Introduction
The ‘tropical zone’ is typically defined as the region of Earth between the Tropic of Cancer (≈23.5° N latitude) and the Tropic of Capricorn (≈23.4° S latitude). This broad zone – covering about 40% of Earth’s surface area – is determined by the 23.4° tilt on Earth’s polar axis (Figure 1). This zone includes all areas of the Earth where the Sun is at a point directly overhead at least once during the year. The tilt on Earth’s polar axis – known as obliquity of the ecliptic – is one of three orbital cycles affecting Earth’s long-term climate and is the main reason for the distinct seasons in the mid- to high latitudes (Berger, 1988). The tilt varies between 22.1° and 24.5°, over a cycle of about 41,000 years, so today it is roughly halfway between its extreme values. While variations in obliquity play an important role in Earth’s climate over tens of thousands of years, this orbital cycle has no direct relevance to the rapid decadal-scale anthropogenic changes in climate observed since 1850.

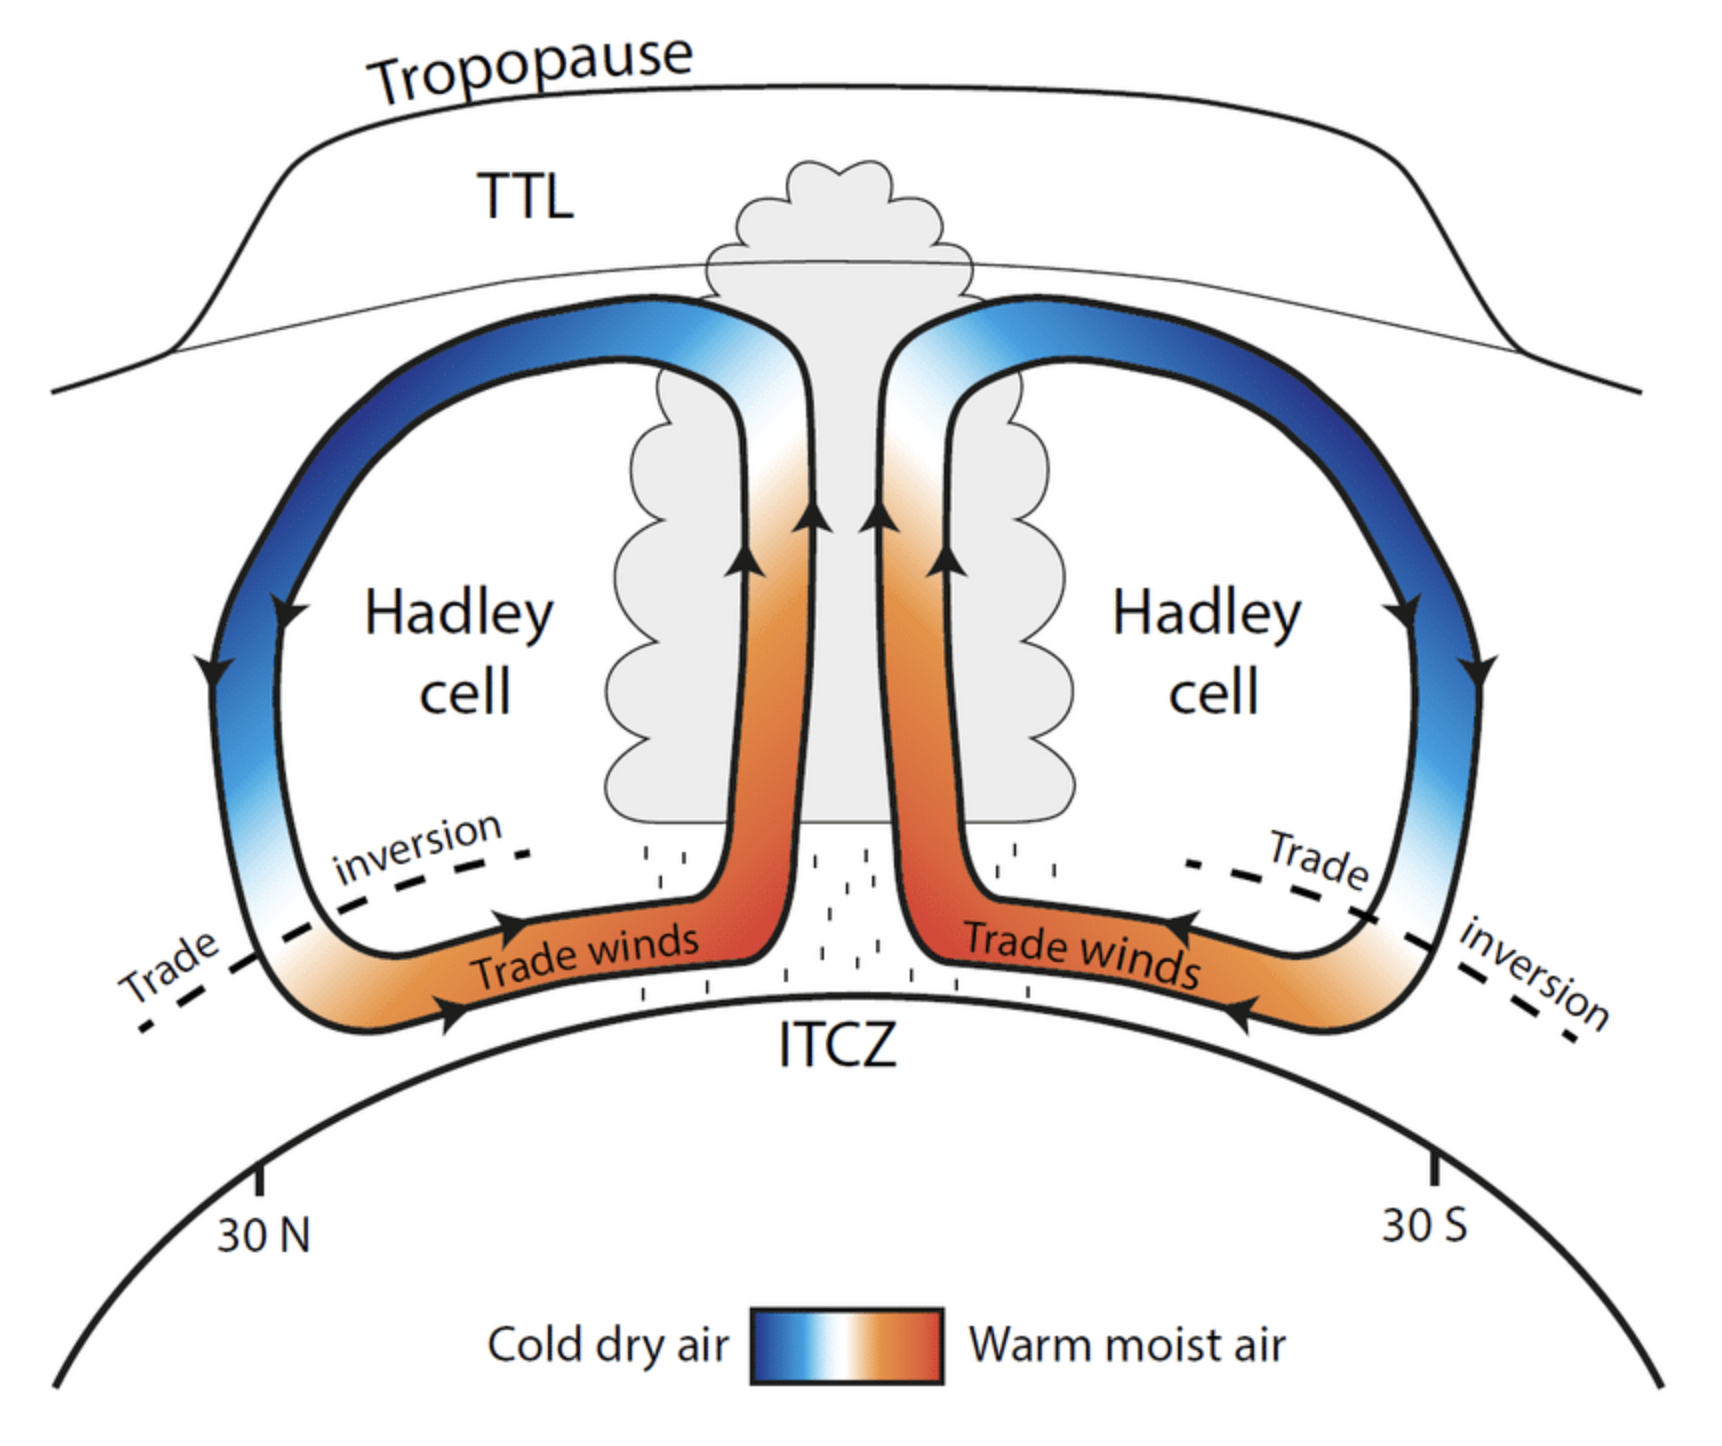
The strictly Cartesian definition of the tropics is not the same as the climatological one (Barry & Chorley, 2010). The poleward edges of the two Hadley Circulations or Cells – roughly between ≈30° N and ≈30° S – are more widely recognised as the average atmospheric boundary between the tropics and extra-tropics either side of the Equator (Figure 1). The Hadley Circulation is a global-scale tropical atmospheric circulation pattern characterised by rising moist air in low latitudes, poleward flow in the upper atmosphere, sinking dry air in the subtropics and equatorward flow at the surface. This thermally driven circulation is a significant component of Earth’s climate system, influencing global weather patterns and – importantly – the distribution of excess heat and moisture from the tropics to the extra-tropics (Barry & Chorley, 2010).
The arid poleward edges of the Hadley Circulation in both hemispheres roughly separate the more thermally uniform tropical climates from extra-tropical (mid- to high latitude) ones, that are instead dominated by highly mobile weather systems known for their rapid longitudinal and latitudinal changes in temperature and moisture content (Barry & Chorley, 2010). Importantly, this climatological definition of the tropics is more useful for explaining likely changes in the tropical/extra-tropical boundary over multiple glacial/interglacial cycles. The boundary expanded poleward during warm interglacial periods and contracted equatorward during cool glacial periods, driven by dynamic changes in the thermally driven Hadley Circulation (Son et al., 2018). This broad tropical zone remained relatively stationary in extent and comprised about 50% of Earth’s total surface area during most of the Holocene, from about 11,700 years ago and through to the beginning of the industrial revolution in 1850s. The subsequent rise of industry, agriculture and human population witnessed an increase in carbon emissions from largely fossil fuel sources and deforestation.
With the advent of the Anthropocene in the 1950s (Zalasiewicz et al., 2015), Earth’s climate system has been increasingly driven by global warming in response to rising greenhouse gases from fossil fuel sources and land use change (IPCC, 2021). The deployment of sophisticated global climate monitoring networks and satellites in the 1970s catalysed numerous independent studies of Earth’s climate system, that have shown that the northern and southern edges of the Hadley Circulation have expanded poleward in response to anthropogenic global warming, resulting in significant changes in precipitation patterns and widening of the subtropical arid zones (Karnauskas & Ummenhofer, 2014 l; Norris et al., 2016). In addition to the latitudinal expansion of the Hadley Circulation, the tropical tropopause has also expanded altitudinally (Figure 1), in response to global warming of the oceans and atmosphere (Norris et al., 2016).
In an earlier commentary, I described why Australia is highly vulnerable to an expanding tropical zone (Turton, 2017). This dire situation is largely due to its geographical location and the observed southward shift of its subtropical arid zone into more highly populated and agriculturally productive regions that have historically benefitted from a more benevolent climate. This latitudinal shift is driving decreasing rainfall, general warming and increasing drought conditions in southern Australia, while also increasing the risk of extreme weather events in northern and eastern Australia. In this commentary, I evaluate more recent research on the expansion of the tropics and how this global phenomenon is playing a more significant role in changing Australia’s climate than previously thought, with mostly serious implications for our natural, economic and social systems.
Why are the tropics expanding?
Earth’s tropical atmosphere is growing in all directions, leading one commentator to cleverly refer to this process as Earth’s ‘bulging waistline’ (Heffernan, 2016). Atmospheric and ocean measurements showed that over the 25 years prior to 2008, the three-dimensional increase of the tropical zone was around 5% (Fu et al., 2006; Seidel et al., 2008) – giving rise to the notion that the Earth’s middle is expanding. Similar rates of expansion were observed in later studies (e.g. Hu et al., 2018; Lucas et al., 2014). Averaged across various independent studies this equates to an average poleward expansion of about 80 km per decade in both hemispheres (Figure 1). Over 100 years this rate of expansion could amount to the distance from Rome to London or Brisbane to Sydney. Tropical expansion has been driven by largely human activities, including rising greenhouse gases from combustion of fossil fuels, black carbon and aerosols from industry and forest fires, changes in stratospheric and tropospheric ozone, warming oceans and other anthropogenic atmospheric pollutants (Turton, 2017, 2023).
Other researchers (Hu et al., 2018; Norris et al., 2016) have confirmed that the subtropical arid zones (between ≈15–30° N and ≈15–30° S) are expanding into regions with classic Mediterranean climate sub-types, such as the greater Mediterranean region itself, southern Australia, southern Africa, central Chile and southern California. These climates typically have warm to hot, dry summers and experience most of their annual rainfall in the cooler months. New research (Lionello et al., 2024; Yang et al., 2020) has demonstrated that these arid zones have expanded more in the Southern Hemisphere than the Northern Hemisphere. The reason for the difference is due to the dominance of ocean in the Southern Hemisphere (Lionello et al., 2024). As the subtropical oceans warm due to trapped heat from anthropogenic sources (e.g. combustion of fossil fuels), they are causing a poleward expansion of the southern arid edge of the Hadley atmospheric circulation (Figure 1). These and other recent studies have provided the strongest evidence to date, that tropical expansion is primarily being driven by anthropogenic climate change.
Tropical expansion is also shifting winter storm paths poleward, resulting in extreme droughts and bushfires, particularly in regions with Mediterranean sub-type climates. What is particularly concerning for southern Australia is that tropical expansion has been more pronounced in the ocean-dominated Southern Hemisphere (Lionello et al., 2024). This phenomenon is exposing more densely populated areas of the country to regional warming and drying. Importantly, while natural long-term climate fluctuations have contributed to the observed drying trends, these variations alone cannot explain the extent to which tropical expansion has already occurred (Yang et al., 2020).
The expanding tropics and its effects on Australia’s climate
HISTORICAL CHANGES
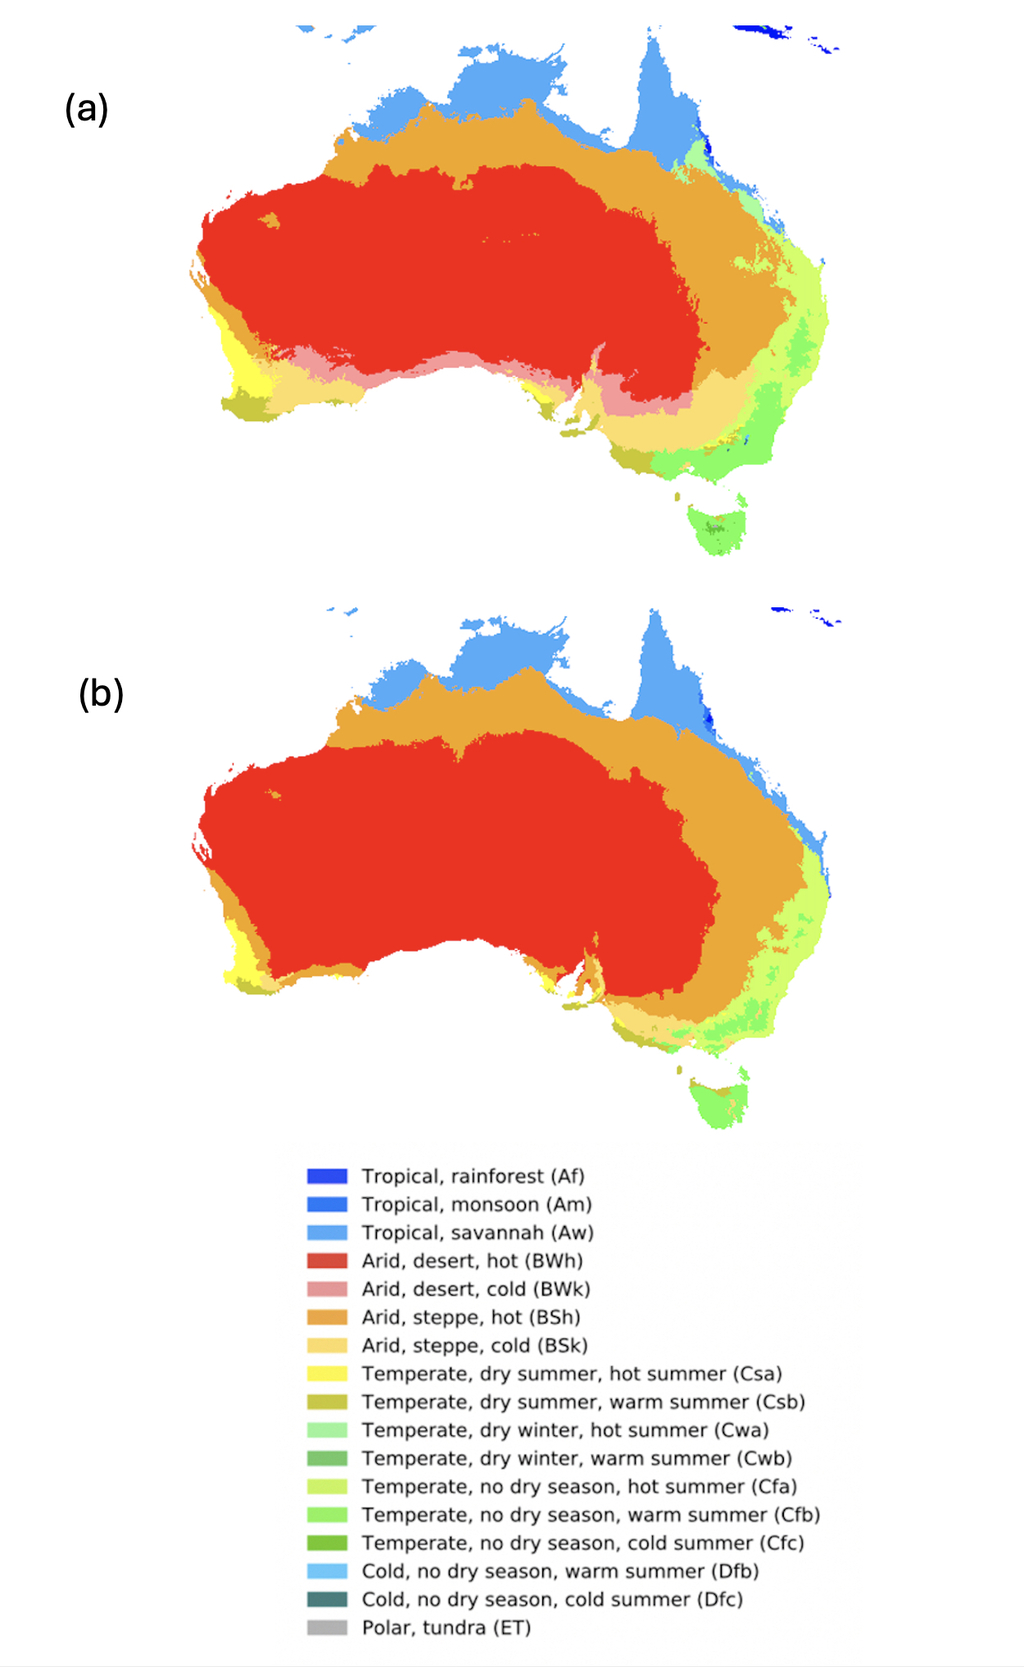
Semi-permanent subtropical high-pressure systems dominate Australia’s climate (Sturman & Tapper, 2006). Two-thirds of the continent is dominated by the Köppen-Geiger system Arid (B) climate class (Figure 2a), making it the driest permanently inhabited continent in the world. The Köppen-Geiger system classifies climate into five main classes and 30 sub-types based on threshold values and seasonality of monthly air temperature and precipitation (Beck et al., 2018). This classification treats vegetation as ‘crystallised, visible climate’ (Köppen, 1936) and aims to empirically map biome distributions worldwide based on common vegetation characteristics, such as savanna. This is a useful mapping tool because the climate of a region is a significant driver of its natural vegetation distribution and agricultural potential.
_kppen-geiger_climate_classification_map_(corrected_to_a_1_km_resolution)_of_australia.jpg)
Australia’s geographical location makes it highly exposed to the expanding tropics, with more than 55% of the continent directly affected by the southern arm of the global Hadley circulation (Figure 1). As the subtropical arid zone expands south, there has been a general warming and drying trend over most of southern Australia. Land areas have warmed by around 1.5° C between 1910 and 2023 (CSIRO and BOM, 2024), and there is now high confidence that annual temperature changes have emerged above natural variability in all land regions (Lawrence et al., 2022). In line with global trends, most warming has occurred since 1950 – with every decade since then being warmer than the ones before (CSIRO and BOM, 2024). As of November 2025, Australia’s warmest year on record was 2019 (2024 globally), and the eight years from 2013 to 2023 all rank in its nine warmest years on record (CSIRO and BOM, 2024). While rising greenhouse gases are the primary driver of background global warming, air and sea surface temperatures vary from year to year in Australia due to natural climatic drivers, including variations in the El Niño-Southern Oscillation (ENSO), Indian Ocean Dipole (IOD), Southern Annular Mode (SAM), 11-year sunspot cycles and episodic volcanic eruptions (Turton, 2023).
In recent decades, warming has been observed across Australia in all months, with both daytime (maximum) and nighttime (minimum) temperatures increasing (CSIRO and BOM, 2024). Notably, very high monthly maximum temperatures that occurred nearly 2% of the time from 1960–1989 occurred over 11% of the time from 2009–2023. This change is more than a six-fold increase over the past 65 years and is beyond natural variability alone (CSIRO and BOM, 2024). There is also high confidence that heat extremes have increased across the country since the 1970s, while cold extremes have decreased over the same period (Lawrence et al., 2022).
Australia is already known for its generally dry climate (Figure 2a), so any changes in precipitation (rainfall and alpine winter snowfall) are likely to have mostly adverse environmental and socio-economic implications. Annual and seasonal rainfall across Australia is highly variable and is strongly affected by ENSO, IOD and SAM phases, and their interactions (Turton, 2023). Despite very high rainfall variability from year-to-year, long-term trends in rainfall for some regions of Australia are evident (CSIRO and BOM, 2024). April to October rainfall in the southwest has declined by about 16% since 1970, while winter (May to July) rainfall has declined by nearly 20% over the same period. This decline in annual rainfall is a very worrying trend for a region that has a classic Mediterranean (very dry summer/wet cool season) climate (see Csa and Csb climate sub-types in Figure 2a). These climate subtypes suit broadacre winter crops like wheat, and high-value summer viticulture in growing regions such as Margaret River and Barossa Valley. It is now highly likely that the significant decline in rainfall across the southwest from 1910 to 2019 was attributed to human influence (Lawrence et al., 2022). Similarly, in the continental southeast, there has been a decline of around 9% in April to October rainfall since 1994. Meanwhile, summer (October–April) rain across northern Australia has increased by about 20% since 1994 (CSIRO and BOM, 2024). There has also been an observed increase in heavy rainfall events across northern Australia and a decline in snow cover and depth in the alpine areas of the southeast mainland and Tasmania since the late 1950s (Lawrence et al., 2022).
Heavy short-term rainfall events are becoming more intense across Australia under global warming and the associated expansion of the tropics (Lawrence et al., 2022; Turton, 2025). The intensity of short-duration extreme rainfall events has also increased by around 10% or more in parts of Australia in recent decades, with the largest increases mostly observed in the north and east of the country (CSIRO and BOM, 2024). Warmer air can hold more water vapour than cooler air, and moisture in the atmosphere can increase by 7% per degree of warming. When the correct atmospheric triggers are in place, this excess moisture falls as intense rainfall. More recent research has found the increase per degree of global warming was about 7–28% for hourly or shorter duration extreme rainfall, and 2–15% for daily or longer extreme rainfall (Wasko et al., 2024). Short-duration extreme rainfall events (such as high six hourly total rainfalls) are often associated with flash flooding, which brings increased risk to human communities, such as the catastrophic 2021–2022 eastern Australian floods (Callaghan, 2023).
Hydrological gauges are a valuable indicator of long-term effects of climate change on streamflow, as they provide continuous monitoring over at least 30 years – affording analysis of discernible climate trends. The observed long-term reduction in rainfall across many parts of southern Australia has led to reduced streamflow. Three-quarters of Australia’s hydrological reference stations show a declining trend in median streamflow, with a quarter of these show a statistically significant declining trend (CSIRO and BOM, 2024). Meanwhile, only 4% of gauges – mostly in northern Australia – have shown significant increases. Declines in annual median streamflow have occurred in the Murray-Darling Basin, the southwest coast, the South Australian Gulf and the southeast (Victoria and New South Wales) drainage divisions. By comparison, in the Tanami-Timor Sea Coast drainage division in northern Australia, which includes Darwin and much of the Northern Territory, there has been an increasing trend in annual median flows at about 67% of the gauges since 1975 (CSIRO and BOM, 2024). This trend is due to increased wet season, monsoonal rainfall across northwest Australia.
Australia’s largest food production region – the Murray–Darling Basin – has experienced significant declines in median streamflow since records began in 1970 (CSIRO and BOM, 2024), but patterns vary across the large basin. In the northern basin, 94% of the gauges show a declining trend in median streamflow, compared with about 75% for those in the southern basin. Water security is crucial for irrigated crops, but water use for agriculture must be balanced with the requirement for maintenance of environmental flows. Declining cool season rainfall, increasing average temperatures and evaporation rates across the basin are being driven by the southward movement of the subtropical arid zone (Figure 1).
Australia has always been a global bushfire ‘hotspot’, mainly due to its highly variable annual and seasonal rainfall, hot summers and dominance of ‘pyrophytic’ vegetation (e.g. eucalypts and acacias). The Forest Fire Danger Index (FFDI) is employed to forecast bushfire weather risk. The FFDI indicates the fire danger based on temperature, rainfall, humidity and wind speed (McArthur, 1967). Based on this index, there is medium confidence that the frequency of extreme fire weather days has increased, and the annual fire season has become longer since 1950 at many locations – especially in southern Australia (Lawrence et al., 2022). These FFDI increases are particularly evident during spring and summer and are associated with an earlier start to the southern Australian fire weather season (CSIRO and BOM, 2024). Climate change contributes to these changes in fire weather by affecting temperature, relative humidity and associated changes to the fuel moisture content (Lawrence et al., 2022). The increased frequency, intensity and longevity of extreme heat due to global warming and the southward displacement of the subtropical arid zone have exacerbated extreme fire weather risk and bushfires in southern and eastern Australia since the 1950s. An unprecedented 21% of Australia’s forests burned during the catastrophic 2019–2020 bushfire season – an amount considered globally unprecedented. This extreme event was a consequence of years-long droughts linked to warming and drying associated with climate change (Boer et al., 2020).
Average sea surface temperature around the Australian region has warmed by more than 1.1° C since national records began in 1910, with 9 of the 10 warmest years on record have occurred since 2010 (CSIRO and BOM, 2024). Australia’s warmest year on record for its surrounding oceans was 2024. The long-term warming trend means that most years are now warmer than almost any observed during the 20th Century (CSIRO and BOM, 2024). The most significant ocean warming since 1970 has occurred around southeastern Australia and Tasmania (CSIRO and BOM, 2024). There is now very high confidence that the East Australian Current is extending further south (Ridgway & Hill, 2009), creating an area of more rapid warming in the western Tasman Sea. This rate of ocean warming is now twice the global average (Lawrence et al., 2022). There has also been ocean warming across large areas of the Indian Ocean region to the southwest of Australia. Oceanic warming around Australia has been linked to the poleward displacement of the southern edge of the Hadley circulation, particularly in the subtropics (Figure 1).
Warming of the ocean has contributed to longer and more frequent marine heatwaves (high confidence), including those resulting in mass coral bleaching of parts of the world heritage listed Great Barrier Reef in 2016, 2017, 2020, 2022 and 2024 (Spady et al., 2025). Recent analysis of 124 reefs on the Great Barrier Reef shows coral cover has dropped sharply after the record-breaking marine heatwave in 2024, raising significant concerns about the future of this global icon (Ceccarelli et al., 2025). Severe coral bleaching was also observed on the world heritage Ningaloo Reef in northwest Western Australia in early 2025. Other adverse oceanic warming impacts around Australia include depletion of southern kelp forests and seagrasses, a poleward shift in some marine species, algal blooms and increased disease occurrence (Turton, 2023). Marine heatwaves are defined as periods when temperatures are in the upper range of historical baseline conditions for five days or more (CSIRO and BOM, 2024). Unlike terrestrial heatwaves, those in the ocean often persist much longer, occasionally lasting multiple months or even years (Oliver et al., 2021).
The global mean sea level has risen by about 22 cm since 1900 with nearly half of this increase happening since 1970 (CSIRO and BOM, 2024). Sea level change varies globally and regionally, partly due to the natural variability of the climate system due to effects of climate drivers such as ENSO and IOD. The rates of sea-level rise to the north and southeast of Australia have been significantly higher than the global average, while rates of sea-level rise along the other coasts of the country have been closer to the worldwide average (CSIRO and BOM, 2024). Higher rates of sea level rise and ocean warming off southeast Australia are being driven by the southward displacement of the East Australian Current (Turton, 2023). This may indicate the emergence of climate change impacts from a poleward shifting and strengthening of the subtropical ocean gyre circulation, of which this warm current is a component (CSIRO and BOM, 2024). Consequently, sandy shorelines have retreated in many locations in southeast Australia, contributing to increased coastal flooding in some densely populated areas (Lawrence et al., 2022).
Tropical cyclones may affect the Australian region anytime between November–April each Austral summer. On average, about 13 cyclones form in the greater Southeast Indian/Southwest Pacific region (Turton, 2019). Cyclone activity varies substantially from year-to-year, partly due to the influence of large-scale climate drivers like ENSO and IOD (Turton, 2023). Cyclone numbers around Australia generally decline with El Niño and increase with La Niña. Historically, tropical cyclones have impacted coastal areas of Australia north of about 30° S but are more common in tropical latitudes where sea surface temperatures are favourable for their formation (Turton, 2025). However, there has been a decrease in the frequency of tropical cyclones observed in the northern Australian region since 1982 (CSIRO and BOM, 2024).
While there appears to be a transition to fewer but more intense tropical cyclones in the Australian region, the forward speed of cyclones in the region has also slowed by 15 to 20 per cent from 1949–2016 (Kossin, 2018; Turton, 2025). A slowing of the forward speed increases the risk for prolonged periods of destructive winds and flooding rains, as cyclones cross populated coastal areas. The trend in tropical cyclone intensity is more complex to quantify across the greater northern Australian region (CSIRO and BOM, 2024). However, cyclone activity is increasing in southeast Queensland, northern New South Wales and some parts of Western Australia (Australian Academy of Science, 2021). This pattern is due to the observed southward shift in cyclone activity under the expanding tropics (Sharmila & Walsh, 2018; Turton, 2025). This poleward trend brings increasing cyclone risk to more highly populated subtropical locations, such as southeast Queensland and northern New South Wales.
Climate change influences the frequency, magnitude and effects of many types of extreme weather and climate events (Seneviratne et al., 2021). When such events occur consecutively within a short period of each other or when multiple types of extreme events coincide, the combined effects often amplify the overall severity (Lawrence et al., 2022). Notably, heatwaves can significantly affect ecological and agricultural systems when combined with prolonged drought stress. Extreme climate events are more likely when natural climate variability acts to amplify the background influence of anthropogenic climate change (CSIRO and BOM, 2024). Record-breaking extreme heat and record-breaking fire weather events are more likely when the ENSO or IOD favour warmer and drier conditions in Australia (Turton, 2023). There is now high confidence that the significant decrease in rainfall in the southwest of Australia since the 1970s is due to human influence and increased agricultural and ecological droughts in the region (Lawrence et al., 2022). In comparison, there is medium confidence that the observed decrease in rainfall in continental southern Australia has led to increased agricultural and ecological droughts over many parts of the region (Lawrence et al., 2022).
Agricultural and ecological droughts in Australia are associated with compound extreme events, driven by global warming and the southward movement of the subtropical arid zone (Turton, 2017). The extreme drought affecting parts of southern Australia in 2023–2025 is illustrative of this general drying trend. For the 27-month period from April 2023 to July 2025, areas with severe or serious rainfall deficiencies (rainfall totals in the lowest 5% or 10% of periods, respectively, since 1900) extended across large areas in the south-west and west of Western Australia, agricultural regions of South Australia, south-western Victoria and small areas in the eastern parts of the west and east coasts of Tasmania, and the Bass Strait islands (BOM, 2025). Areas with lowest on record rainfall included a large region extending inland around Perth in Western Australia, parts of the Yorke Peninsula and Mid North districts in South Australia, and the coastline from Warrnambool to Cape Otway in Victoria (BOM, 2025). The catastrophic algal bloom off parts of the South Australian coast in 2025 has been partly driven by this prolonged drought and the associated lack of rainfall and cloud cover, following a high catchment runoff event. These unusual conditions have allowed a severe marine heatwave to form offshore, with sea temperatures around 2.5° C above long-term average since September 2024. The ecological and socio-economic consequences of the South Australia algal bloom event are likely to be very significant.
FUTURE CHANGES
Climate projections suggest a generalised expansion of the tropical zone (Figure 1) in the Southern Hemisphere this century (Lionello et al., 2024). Australia’s main climate zones (Figure 2) are already shifting in response to this phenomenon, and this will continue with global warming (Turton, 2023). The extent of any future changes to the geographical location of climate zones will depend on global carbon emissions (Urdiales-Flores et al., 2024). Notably, the Temperate dry summer (Mediterranean) sub-types (Csa and Csb) in southern and southwest regions are projected to move further south (Figure 2b). This southward contraction of these sub-types will have significant adverse impacts on the biologically diverse ecosystems and agricultural systems that depend on these Mediterranean climate sub-types (Lawrence et al., 2022). In the east and southeast, shifts in climate zones are also likely. The Tropical savanna sub-type (Aw) is likely to shift further south into the subtropics of Queensland, replacing the Cwa sub-type (Figure 2a, b). Temperate dry winter sub-types (Cwa and Cwb) are projected to move south into parts of northern and central New South Wales, replacing the Temperate (no dry season) sub-type (Cfa). The Cfa (hot summer) sub-type will shift into southern New South Wales, replacing the Cfb (warm summer) sub-type. Lastly, the tiny area of the Cold summer sub-type (Dfb) is likely to eventually disappear entirely under medium-to-high carbon emissions pathways (Figure 2b). This reduction will have severe consequences for Australia’s unique alpine ecosystems and snow-based tourism and recreation (Lawrence et al., 2022).
Many of the historical changes in Australia’s climate – described above – are expected to follow the same trends with global warming (Turton, 2023). However, future carbon emissions pathways will determine the rate and magnitude of changes (Lawrence et al., 2022). Australia may expect continued increases in average air temperatures, particularly away from the coast –along with more frequent, prolonged and severe heat wave events. Most areas of southern Australia, particularly the southwest and continental southeast, may continue their drying trend for winter and spring rainfall. However, significant changes in annual rainfall for northern Australia are less certain.
Potential strengthening of ENSO and IOD cycles will likely mean more pronounced drought and flood events across Australia in the future (Lawrence et al., 2022). Such hydroclimate volatility refers to sudden, large and/or frequent transitions between droughts and floods and vice versa (Swain et al., 2025). Such rapid wet-to-dry and dry-to-wet swings have been termed ‘hydroclimate whiplash’ and are projected to intensify with global warming (Swain et al., 2025). Severe drought years will exacerbate fire weather conditions and worsen as baseline temperatures and evapotranspiration rates shift upwards. The intensity, frequency and duration of fire weather events are projected to increase throughout Australia, particularly southern, southeast and southwest regions with high confidence. All parts of the country may expect to witness more extreme rainfall events as the oceans and atmosphere warm. Winter snow cover and depth is projected to decline in alpine areas, with significant implications for spring and early summer runoff into the Murray River system.
Oceans around the country will continue to warm, including the southward movement of the warm East Australian Current. Warming oceans will mean a much greater risk of marine heatwaves and intense tropical cyclones (Turton, 2025) and East Coast Lows (Turton, 2023). Depending on the extent of oceanic warming, the tropical cyclone belt may continue its southward movement into regions where cyclones were historically either absent or rare (Turton, 2025). Increasing ocean acidification and deoxygenation is expected in the waters around the country, resulting in adverse impacts on marine biodiversity and commercial fisheries (Turton, 2023, 2025). Sea level is expected to continue to rise around the country, with some regional differences (Lawrence et al., 2022). This will contribute to increased coastal flooding and shoreline retreat along highly populated sandy coasts (high confidence). Marine heatwaves are projected to become more frequent and longer lasting, threatening marine ecosystems like kelp forests and increasing the risk of more frequent and severe coral bleaching on coral reefs around Australia, including the Great Barrier and Ningaloo reefs (high confidence).
Even if the Paris Agreement’s temperature targets of 1.5° C and 2.0° C above pre-industrial levels (1850–1900) are met by 2100, climate projections indicate that Australia will still experience ongoing climate change for many decades to come (Turton, 2023). If warming exceeds 2.0° C above pre-industrial, there will certainly be greater warming, more significant drying of southern regions and more pronounced climate extremes (Australian Academy of Science, 2021; Lawrence et al., 2022). Compound changes in several climatic impact-drivers (e.g., heatwaves, droughts, floods) would be more widespread at 2° C compared to 1.5° C of global warming and even more widespread and pronounced for higher warming levels (high confidence). Sand and dust storms are projected to increase throughout Australia (medium confidence), while an increase in aridity and agricultural and ecological droughts is likely in southern and eastern Australia (medium confidence). Lastly, as the subtropical arid zone moves south there is medium confidence that there will be an increase in meteorological droughts in southern Australia (Lawrence et al., 2022).
Conclusion
Australia is on the frontline of global climate change, with its range of climate types already responding to the steady expansion of the subtropical arid zone. This expansion, largely driven by anthropogenic greenhouse gas emissions, is shifting the southern edge of the Hadley circulation poleward and intensifying extreme weather and climate events across the country. Southern Australia is experiencing declining rainfall, rising temperatures, more frequent heatwaves, longer fire seasons and worsening drought conditions. In contrast, northern Australia is seeing increased monsoonal rainfall and streamflow, although risks from extreme rain and flood events and tropical cyclones are also growing.
Ocean warming is a major concern, particularly off southeastern Australia, where sea surface temperatures are rising at twice the global average. Marine heatwaves are threatening shallow-water coral reefs, kelp forests, biodiversity and fisheries, with far-reaching ecological and economic impacts. Future projections suggest continued warming, drying and climate extremes, even if global warming is limited to 1.5–2.0° C above pre-industrial levels later this century.
Australia’s unique geography makes it particularly vulnerable to these changes in climate. Shifts in climate zones will disrupt ecosystems, agriculture, water availability and exposed human communities. The evidence is clear: Australia must prepare for ongoing and intensifying climate impacts, and urgent climate mitigation and adaptation are needed to reduce future risks and safeguard human communities, biodiversity, food and water security and supply of crucial ecosystem services.
Ethics approval and consent to participate
Not applicable.
Availability of data and material
Not applicable.
Competing interests
None.
Funding
None.
Acknowledgements
I thank the editors of the South Australian Geographical Journal for the opportunity to publish this commentary in the journal’s Special Issue: Geography Futures Past.