


INTRODUCTION
South Australia is a state of 1.8 million people within the nation of Australia. It has played a leading role in transiting electricity generation from coal and gas to renewables, particularly solar and wind. National carbon reduction targets, financial incentives, and significant reductions in the cost of renewables have driven the change. Following the ratification of the Kyoto Protocol in 2007, installations of rooftop solar panels and wind farms began and accelerated rapidly. From virtually nil beginnings at the turn of the millennium, to the present when 74.3% of the State’s electricity is generated from renewable sources is truly remarkable in such a short time (DCCEEW, 2025). The consequences of this revolution were far reaching through reducing the climate footprint and energy costs, and also in terms of the visual and other impacts on the South Australian landscape.
The purpose of this paper is to examine this revolution, its dimensions and consequences. Although the paper concentrates on South Australia as a case study, the same revolution is occurring throughout much of Australia.
POLICY
Over the past 25 years, the following policy instruments have been applied (CER, 2024):
-
2001 The Federal Government introduced the Mandatory Renewable Energy Target (MRET) to increase renewable energy by 2%.
-
2007 Australia ratified the Kyoto Protocol.
-
2009 Expanded MRET for 2020; increased from 9,500 GWh to 45,000 GWh and delivered an extra 33,000 GWh annually from 2020 until 2030.
-
2012 MRET split into small-scale and large-scale renewable energy targets to incentivise large scale grid connected renewables.
-
2012 Carbon pricing was introduced but repealed in 2014.
-
2014, the Large-scale Renewable Energy Target for 2020 reduced from 41,000 GWh to 33,000 GWh.
-
2016, Australia signed the Paris Agreement covering climate change mitigation, adaption and finance.
-
2022, by 2030 the national goal to reduce emissions by 43% with 82% of its electricity to be drawn from renewable sources, and net zero emissions by 2050.
-
2025, the Australian Government set a target to reduce emissions by 62-70% below 2005 levels by 2035.
Several States established their own targets. South Australia, which has consistently exceeded the national targets, has set a target of reducing emissions by 60% of 2005 levels by 2030 and by 2027 to achieve 100% renewable electricity generation and to export renewable energy with a target of 500% by 2050.
Feed-in tariffs (FiT) for renewable energy have accelerated the adoption of rooftop solar. Prior to 2011 the FiT was 44 c/kWh which will continue until 2028. Over 87,000 South Australian households received this. Electricity retailers have offered their own FiT depending on the price of electricity and market demand.
The Federal Government established the Clean Energy Finance Corporation (CEFC) in 2012 and by 2025 it had provided over $18B to help decarbonise the economy including renewable energy, alternative fuels, low carbon materials, and greening the energy grid. In South Australia, CEFC provided $220 m in funds for the Lincoln Gap wind farm, the Sundrop solar farm near Pt Augusta, and the virtual power plant in SA Housing tenants. It also provided $200 m in debt finance for the Lincoln Gap wind farm and the Hornsdale battery expansion.
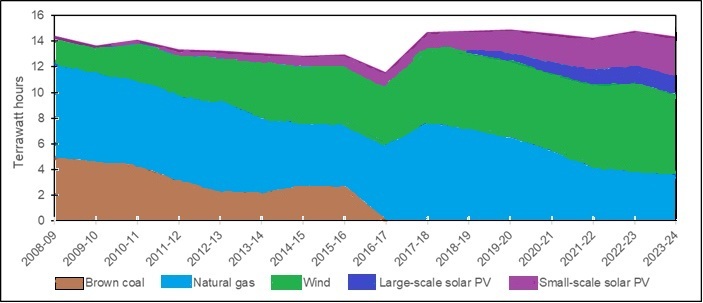
Figure 1 displays the huge shift from fossil fuels to renewables that has occurred in South Australia over the past decade in electricity generation as the use of brown coal ceased in 2017 and gas has been on downward trajectory (DCCEEW, 2025).
.__dcceew__y_572261_.jpg)
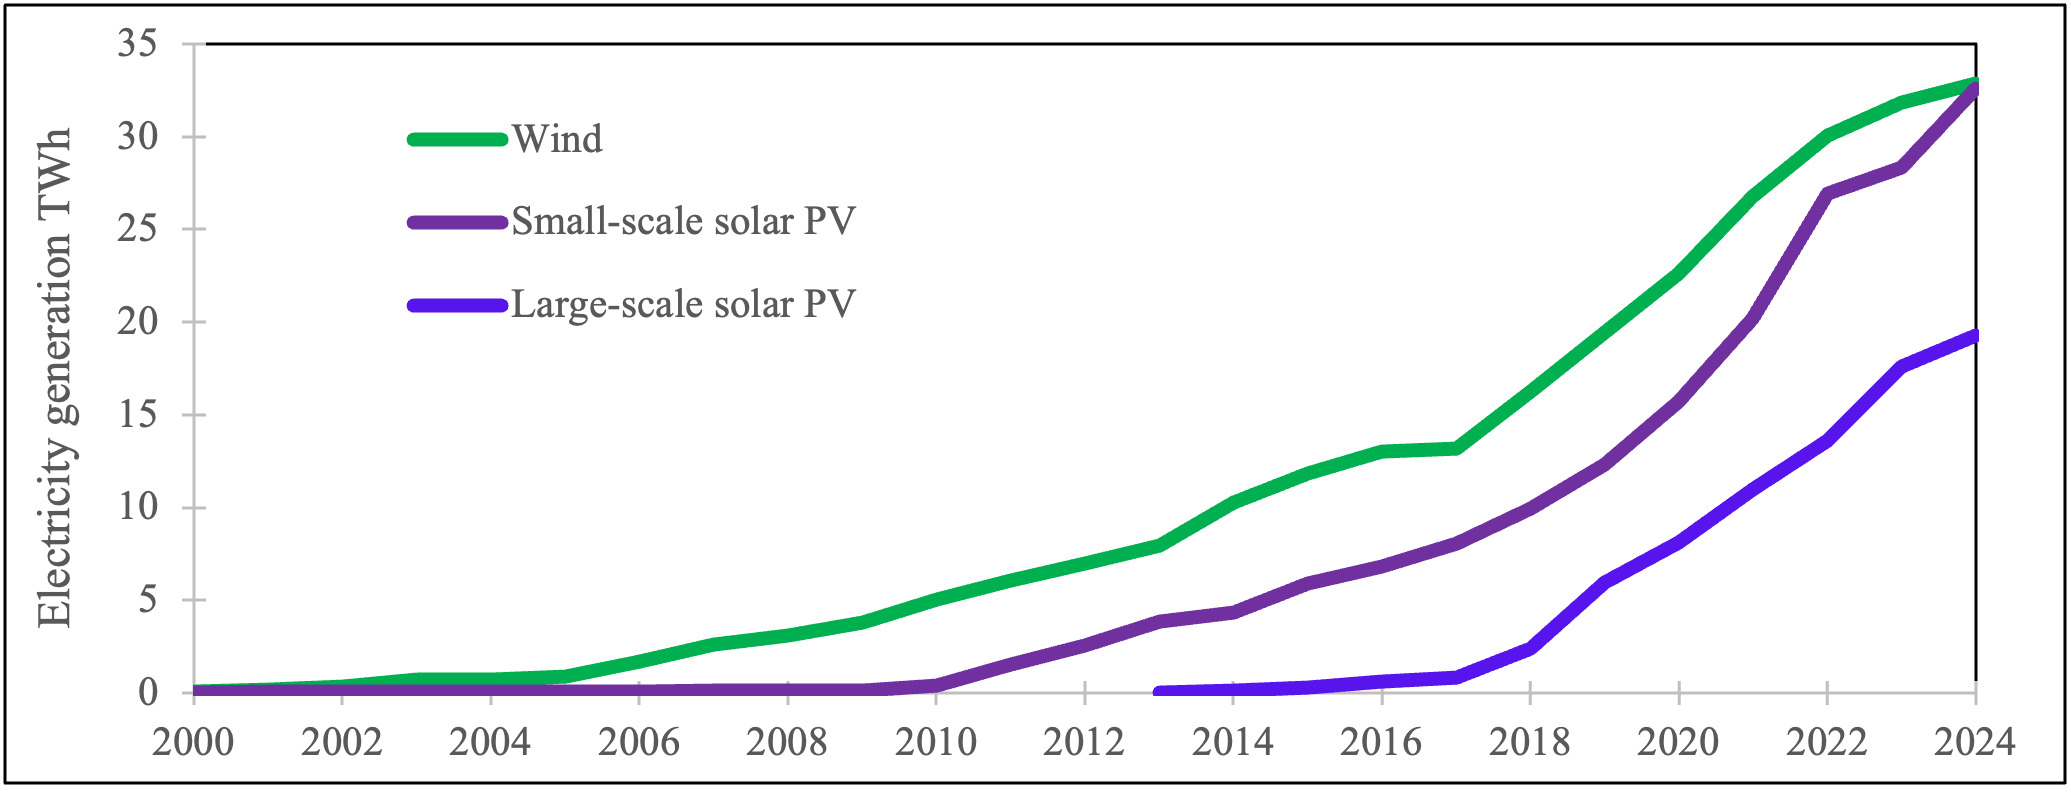
Figure 2 shows that until around 2006, neither wind or solar power virtually existed but then they accelerated to 2024 when they accounted for 36% of electricity generation in Australia and 74.3% in South Australia (DCCEEW, 2025). There have been several stretches of ten days when solar and wind provided 100% of the State’s electricity. In 2007, Australia ratified the Kyoto Protocol regarding greenhouse gas emissions stimulating the launching of rooftop solar and wind farms around Australia.

By April 2024 in Australia, 4.03 million houses had rooftop solar systems installed out of a total of 10.85 million houses (ABS, 2021; CER, 2025). Electricity generated by solar panels now exceeds that by wind turbines due to the addition of large-scale utility solar farms (Figure 2). In South Australia, as displayed in Figure 3, wind generated electricity (6.1 TWh) exceeds that of the combined large and small scale solar (4.5 TWh, 2023/24) (DCCEEW, 2025).
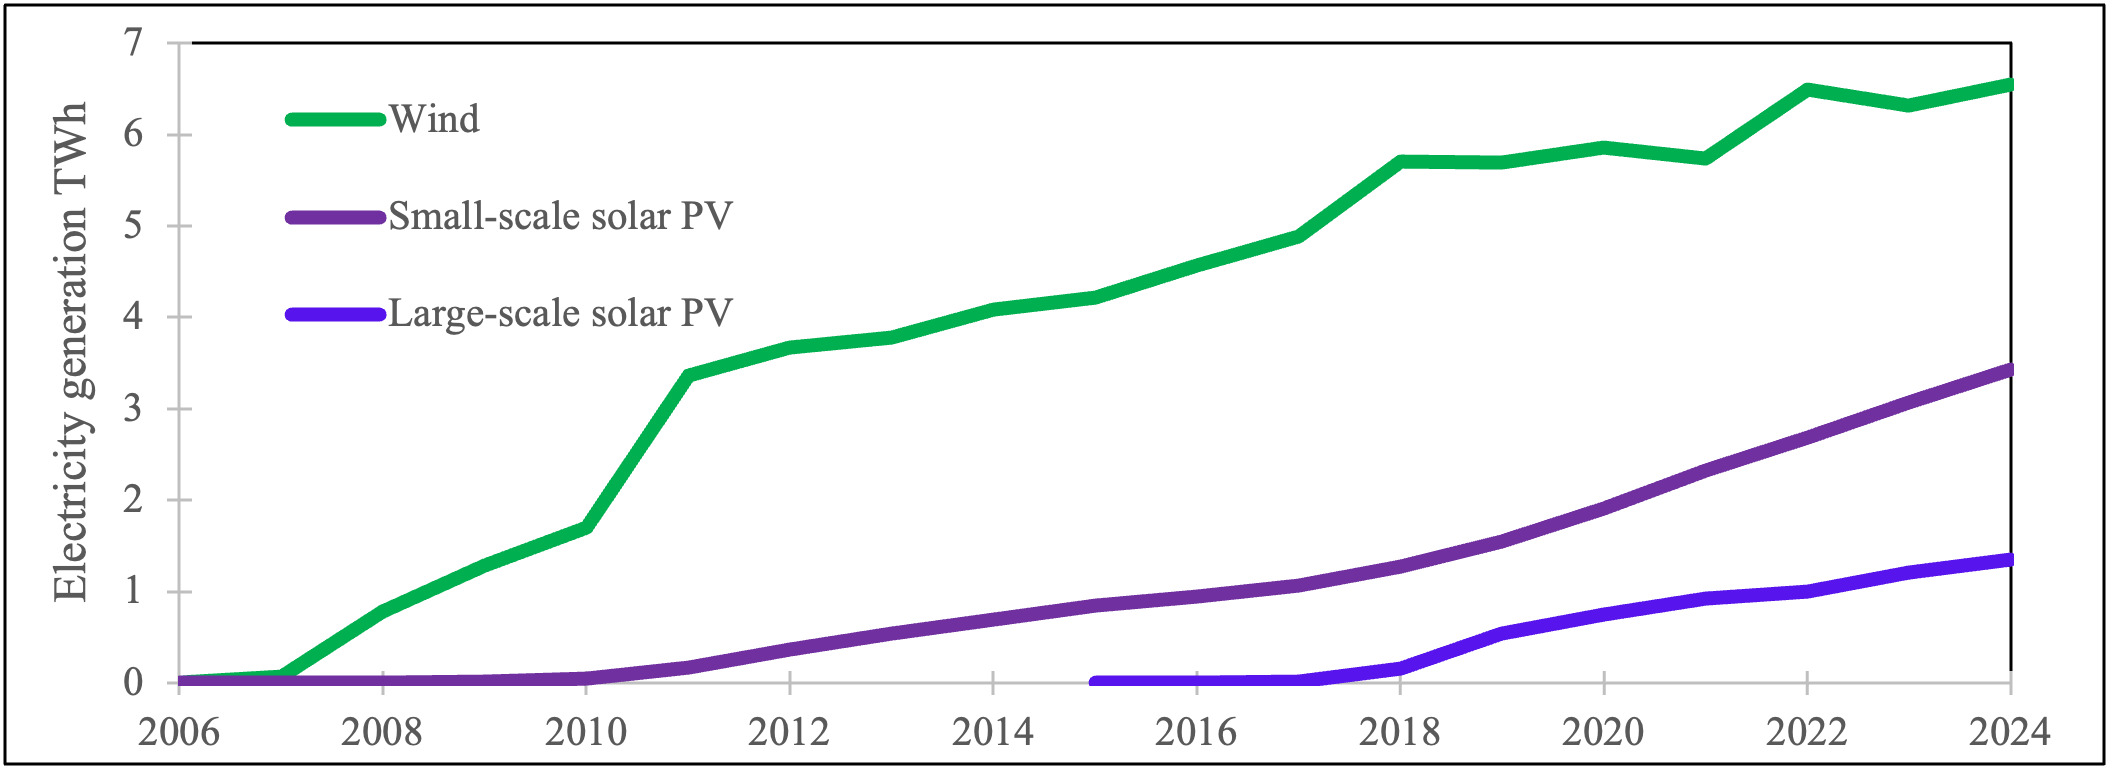
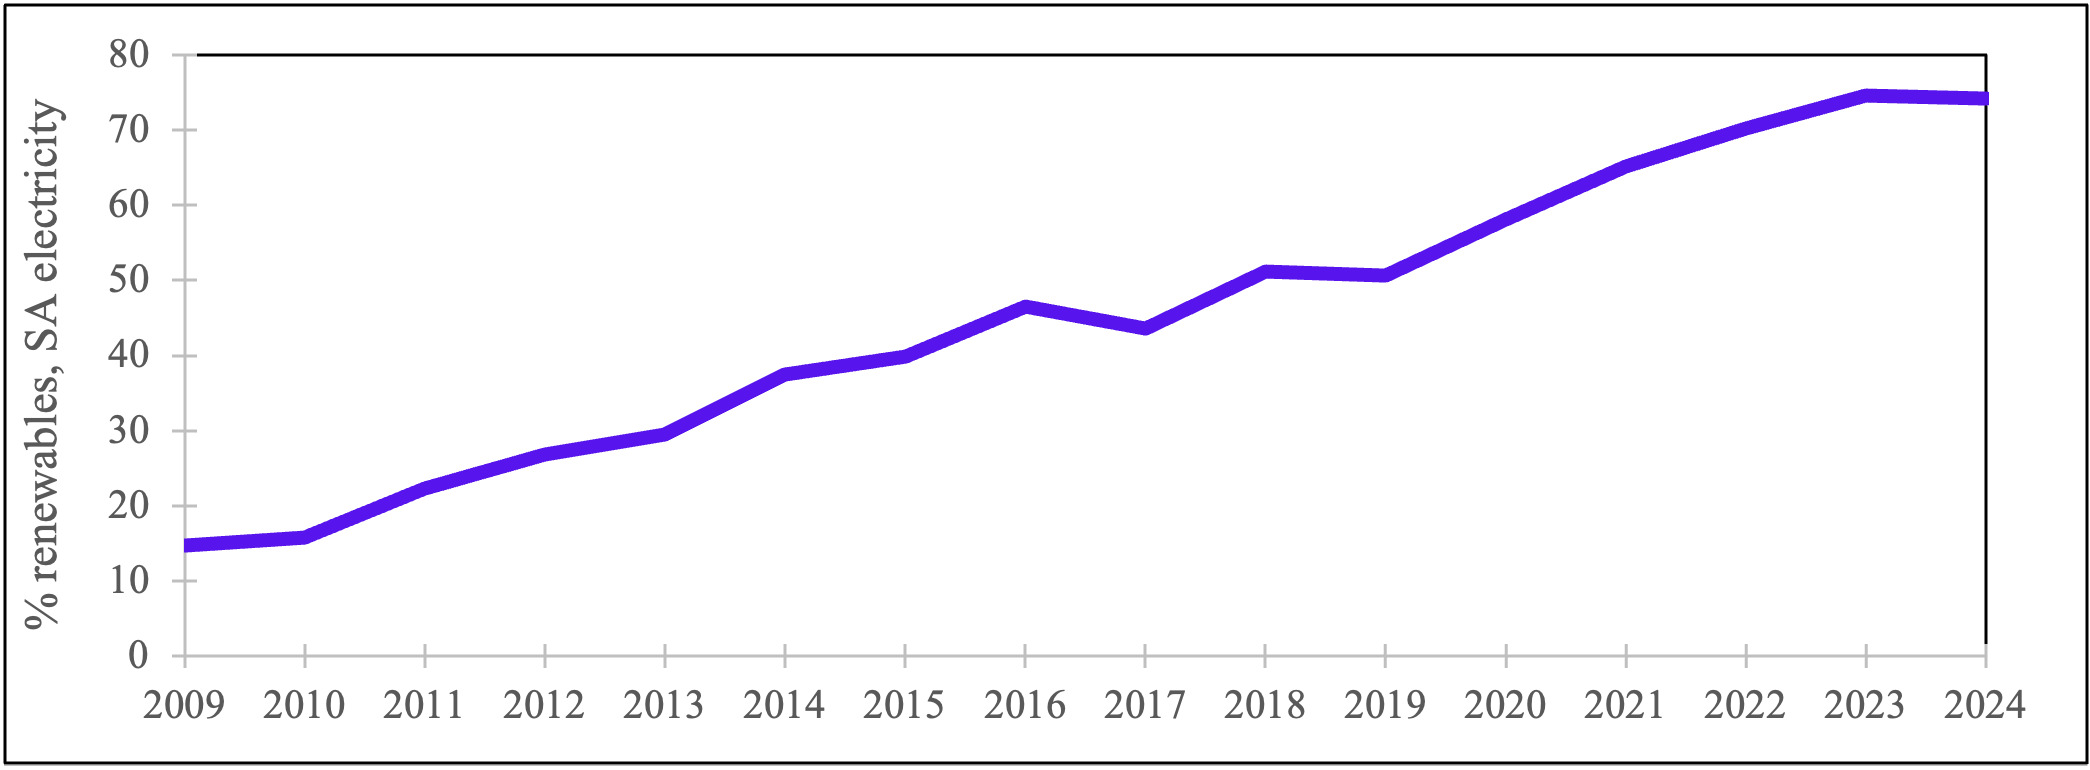
Table 1 shows the penetration of renewables for South Australia and Australia. Apart from Tasmania which has hydro power, SA has the largest amount of renewables of any State, 76.8%, nearly double that of Victoria, the next highest at 39.6%. Renewables for electricity rose quickly from 2006 to their current level (Figure 4).

GREENHOUSE GAS EMISSIONS
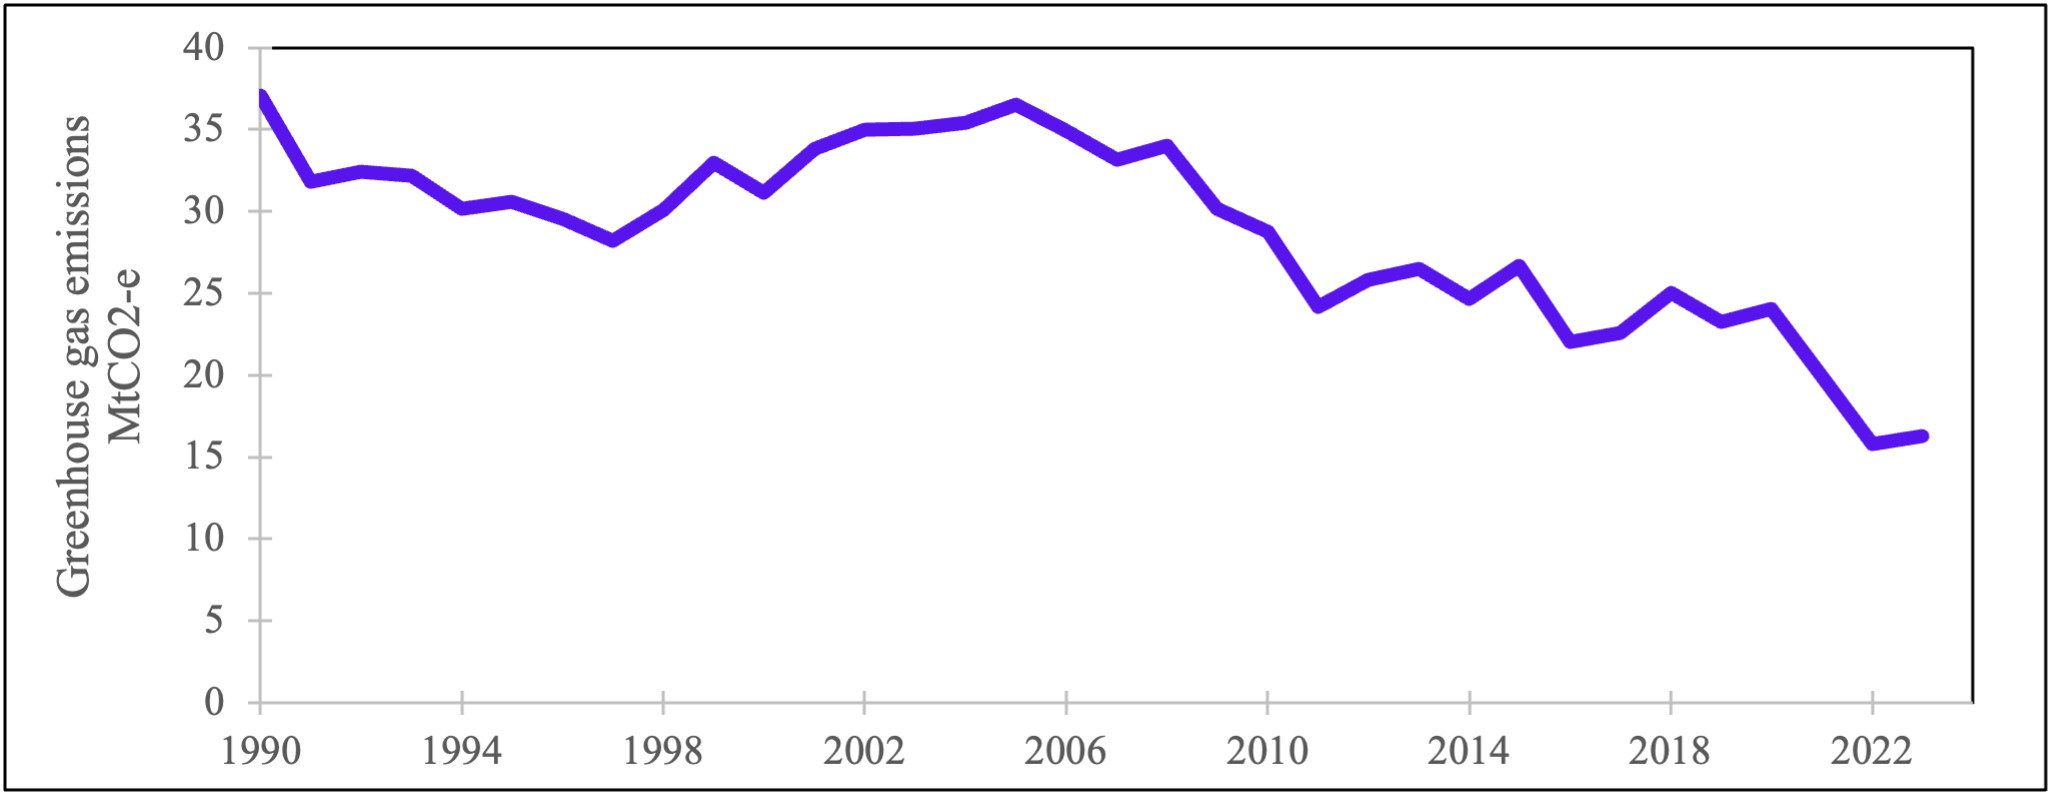
The rise of renewables has resulted in lower emissions intensity of electricity generation in South Australia, from 734 kgCO2-e/MWh in 2009 to 135 kgCO2-e/MWh in 2023, lower by 80% (AEMO, 2024). In 2023 the State’s emissions were 16.3 MtCO2-e, a 52% reduction of the 31.15 MtCO2-e in 2000. Figure 5 shows that the emissions remained static until the renewables kicked in from around 2006. Other State reductions were smaller: Queensland 35%, Victoria 31%, NSW 27%, ACT 10% while Western Australia’s emissions increased by 8% and the Northern Territory’s by 49%.
SOLAR ENERGY
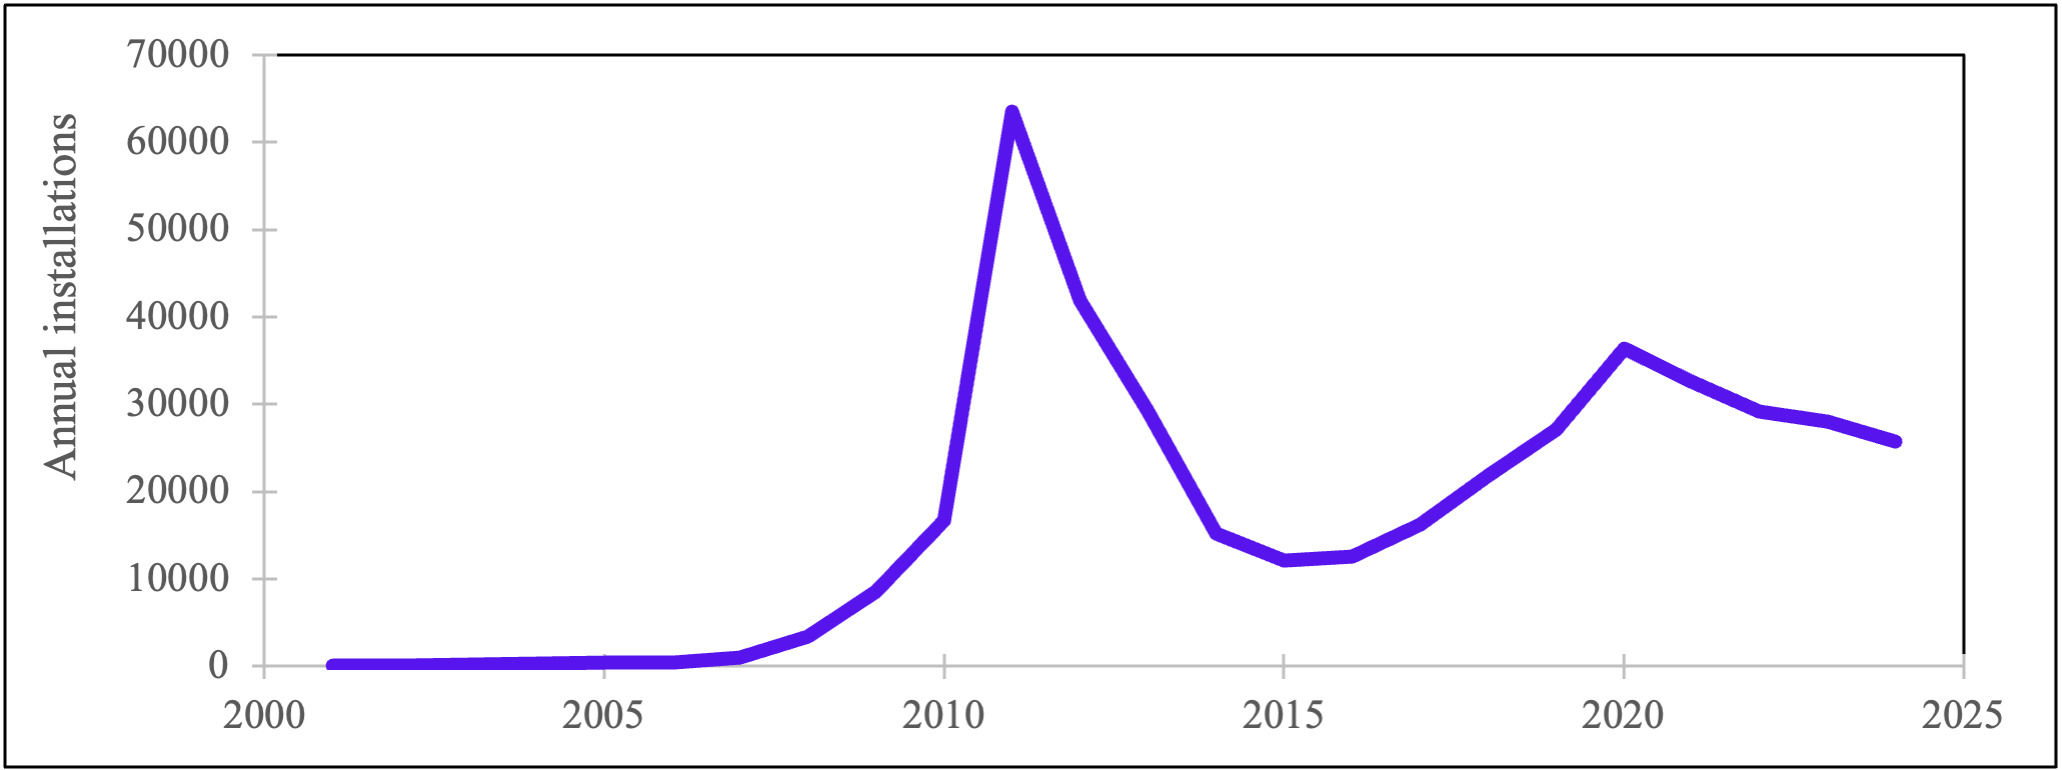
Rooftop solar panels have been installed on over half of South Australia’s houses: 385,000 houses out of 723,000 houses (ABS, 2021, (AEMO, 2024)). By 2024, 2,500 MW generating capacity had been installed, generating 18.3%, or 3,134 GWh (AEMO, 2024). South Australia has one of the highest per capita rooftop solar installations in the world (Peacock, 2023). Apart from the spike of 63,553 installations of rooftop solar in 2011, the average has been around 26,000 installations per year in South Australia (Figure 6).

The average size of rooftop solar panels grew from 1.97 kW in 2010 to 9.98 kW at the end of 2024 (CER, 2025). This is the difference between having three or four solar panels versus a roof of solar panels.
The five top postcodes in South Australia for electricity generated from household rooftop solar systems are Salisbury, 8,829 kW, Hallett Cove 8,408 kW, Greenfields 8,244 kW, Reynella 8,173 kW and Davoren Park 7,843 kW. While postcodes in Adelaide dominated, there were high uptakes in several country areas, e.g. Brukunga 4,918 kW and Crystal Brook 3,682 kW.
In addition to rooftop solar are large-scale utility solar farms. Table 2 lists these and Table 3 lists the combined solar farms and batteries, including those which are operating, under construction or proposed.
Table 3 lists hybrid systems which incorporate solar plus a Battery Storage Energy System (BESS).
The total generating capacity of operating large solar farms listed in Tables 2 and 3 is 1255 MW and a further 2,456 MW of generating capacity from utility scale solar farms are under construction or proposed. Batteries which are operating provide 1,111 MW and 1,991 MWh storage of electricity.
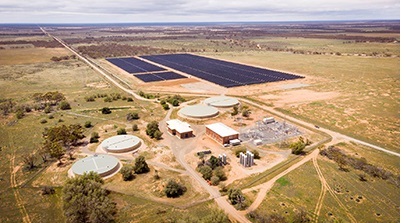
Examples of utility solar farms include two at Bungala near Port Augusta generating 513 MW, and solar farms associated with large trunk water pumping stations such as Morgan-Whyalla Pipeline 7.5 MW, Swan Reach and Mannum, each 30 MW. SA Water has installed 140 MW of solar panels at 33 sites which generate 242 GWh of electricity, plus 17 MW of batteries.
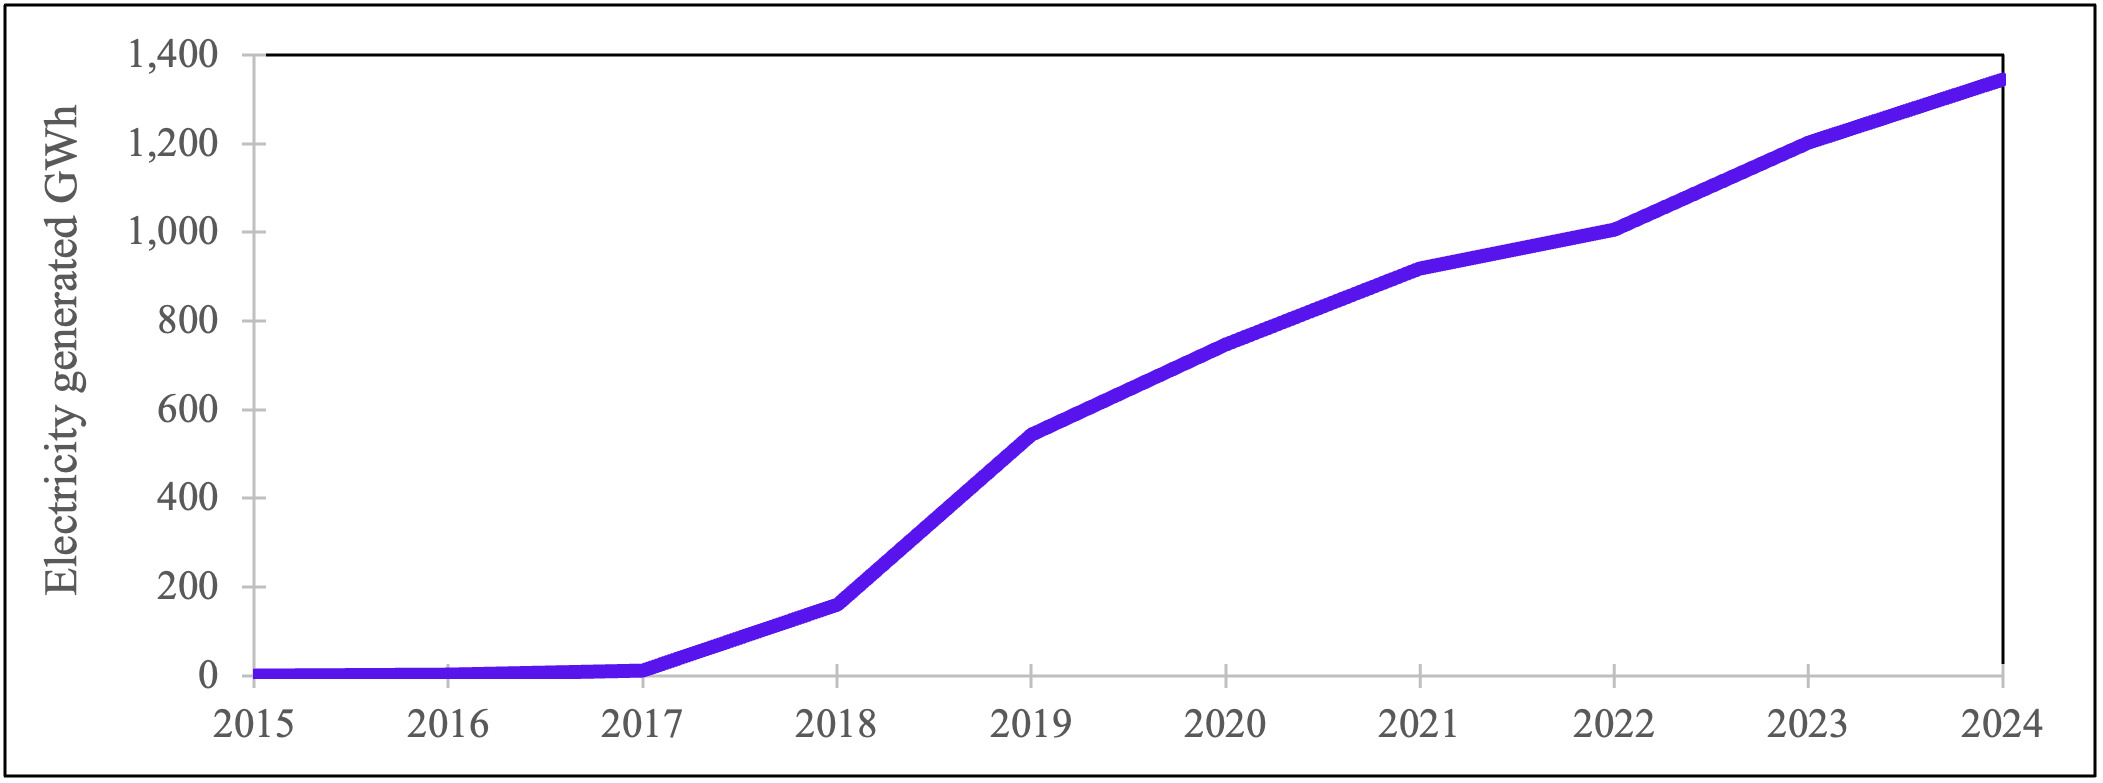
Utility solar commenced in 2018 and has a generating capacity over 19.2 TWh Australia-wide and 1.34 in South Australia (Figure 7).

Lying between domestic rooftop solar and utility solar are medium size solar installations between 100 kW and 5 MW. These were placed over the roofs of industries, schools, hospitals, airport terminals and shopping centres and in 2024 totalled 2,137 installations with a generating capacity of 2,108 MW Australia-wide (CER, 2024). Adelaide Airport has 1,283 kW solar panels installed.

Panels tracking the sun from east to west increase energy output by 20-30% compared with fixed tilt panels. The single-axis tracking systems track north-south whereas the dual-axis tracking moves east-west (up and down) as well which better accounts for seasonal changes.
A recent development has been bifacial solar panels which, as well as facing the sun, draw reflected light from the ground surface, such as a car park or water, thus generating more electricity.
The capacity factor is the energy produced by a generating unit compared with its maximum at full power. Solar panels have a capacity factor of 10 - 25% of their maximum rated power per year.
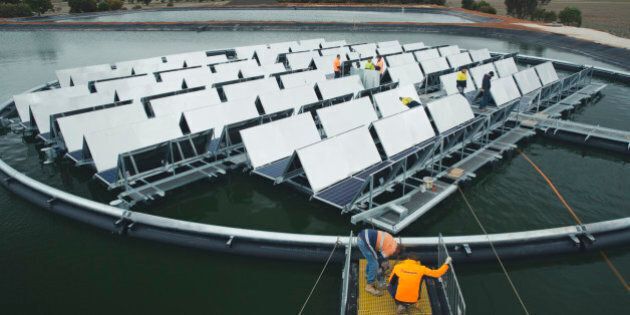
Solar panels, known as “floatovoltaics” (Hernandez et al., 2014) were placed over water such as reservoirs and dams which enabled a much higher efficiency to be reached as the water keeps the panels cool. In Jamestown, the first floating system in Australia was positioned over a wastewater treatment plant and is 57% more efficient than a ground-based system. It used bifacial panels and reduced evaporation from the plant. There is scope for more water-based panels such as over the Bolivar water treatment plant and reservoirs.

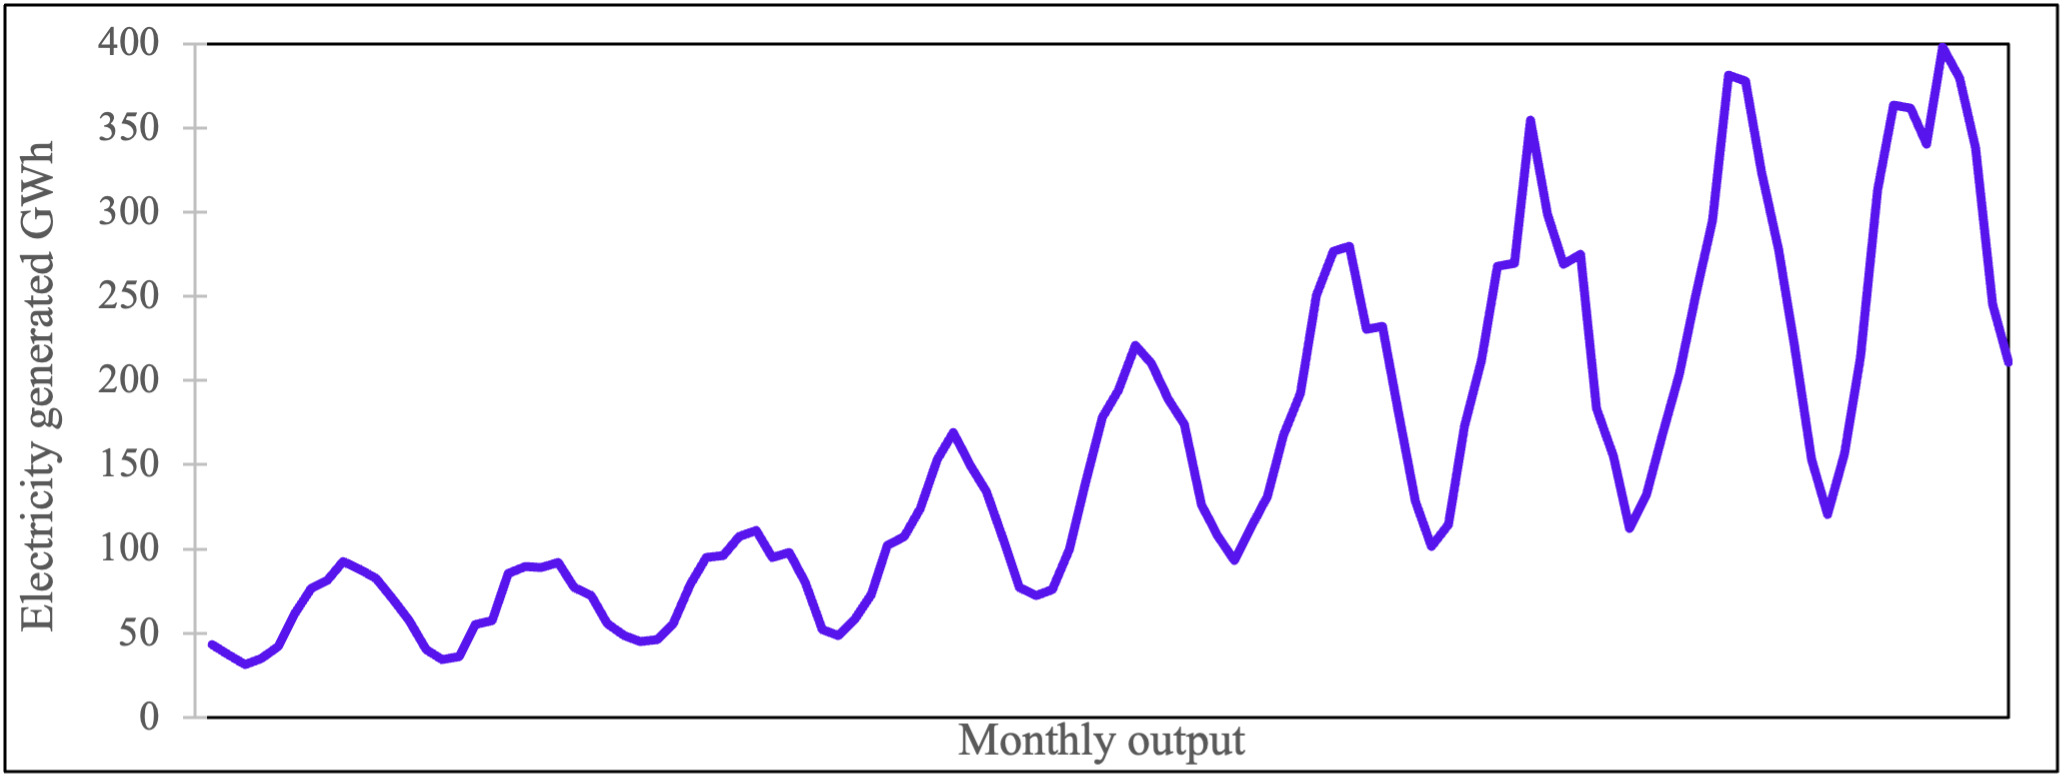
Figure 8 shows the monthly electricity generated from all PV systems in South Australia. The graph illustrates the strong influence of the seasons with high output in summer and lower output in winter. Note however that the current winter output approximates the summer output of about six years earlier.

The carbon footprint of solar is 14 – 73 grams CO2-e/kWh compared with 608 for gas and 975 for coal (Tawalbeh et al., 2020) [17]. Most of the life-cycle emissions for solar and wind are in their manufacture (Table 4). Transport emissions are less than 1%.
WIND ENERGY
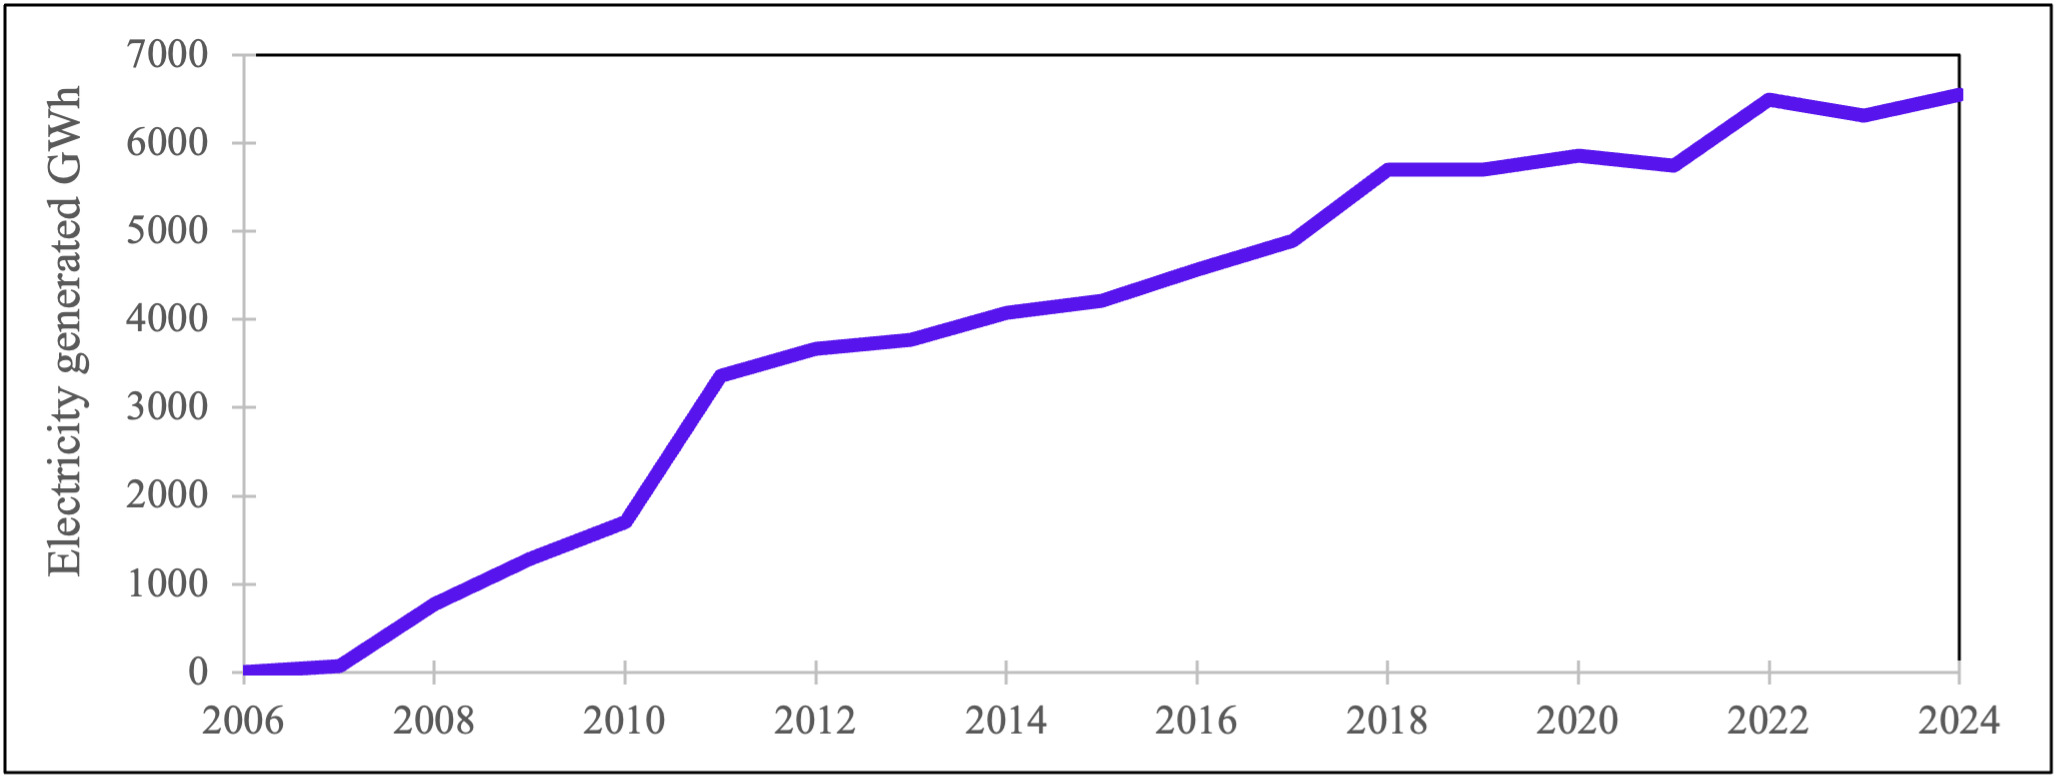
In 2024 there was 2,770 MW of installed wind capacity in South Australia generating 6,546 GWh of electricity, 42.6% of South Australia’s total. In the National Electricity Market in 2024, wind turbines generated 32,894 GWh of electricity of which South Australia generated 20%. Figure 9 summarises the wind generated electricity for South Australia since 2006.

Table 5 and Table 6 summarise South Australia’s 27 operating wind farms. Omitted is the single 150 kw wind turbine installed at Coober Pedy in 1991 and decommissioned in 2017.
Table 6 lists hybrid systems which incorporate wind plus a Battery Storage Energy System (BESS).
An offshore wind farm has been proposed about 10 km off Kingston South East with a capacity of 400-600 MW. It is in the early feasibility stage and construction is unlikely before 2030.
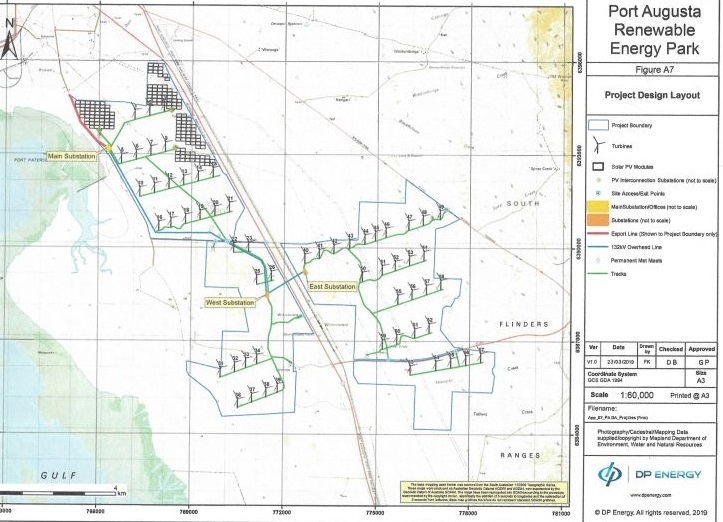
The total height of the turbines has increased over the past two decades from 100 metres to over 200 metres, accompanied by an increase in their generating power from 1.5 MW to over 7 MW. This means fewer turbines are needed to achieve the same output or, conversely, the output is vastly increased over the earlier turbines. Output in the early wind turbines was less than 50 MW whereas the more recent turbines are generating over 200 MW of electricity. The more recent wind farms have been combined with solar farms and batteries, such as the Port Augusta Renewable Energy Park.

The capacity factor of South Australia’s wind farms is relatively high at between 32% and 38% due to the abundant wind resources. This compares with 25% to 30% in Europe and 20% to 40% in the US.
BATTERIES
Batteries store electricity, releasing it for the evening peak demand. In 2024, South Australia had an estimated 314 MW of battery systems with 462 MWh storage in 34,241 units, 40% of the Australian total (AEMO, 2024) (Table 7). The batteries were in only 4.1% of the houses so there is considerable scope for increasing this proportion.
Commencing in 2018, the South Australian Government, in conjunction with Tesla, launched the Virtual Power Plant with potentially 50,000 solar and home batteries providing the world’s largest such plant. 5,500 Housing SA houses were connected. The system has helped to stabilise the electricity system in times of outages and lower power bills for participants.
As well as the small household batteries, in 2023, 27 large-scale utility batteries were installed throughout Australia providing storage for 5 GW/11 GWh (CEC, 2024). Many large-scale batteries have been installed adjacent to large scale solar farms and wind farms.
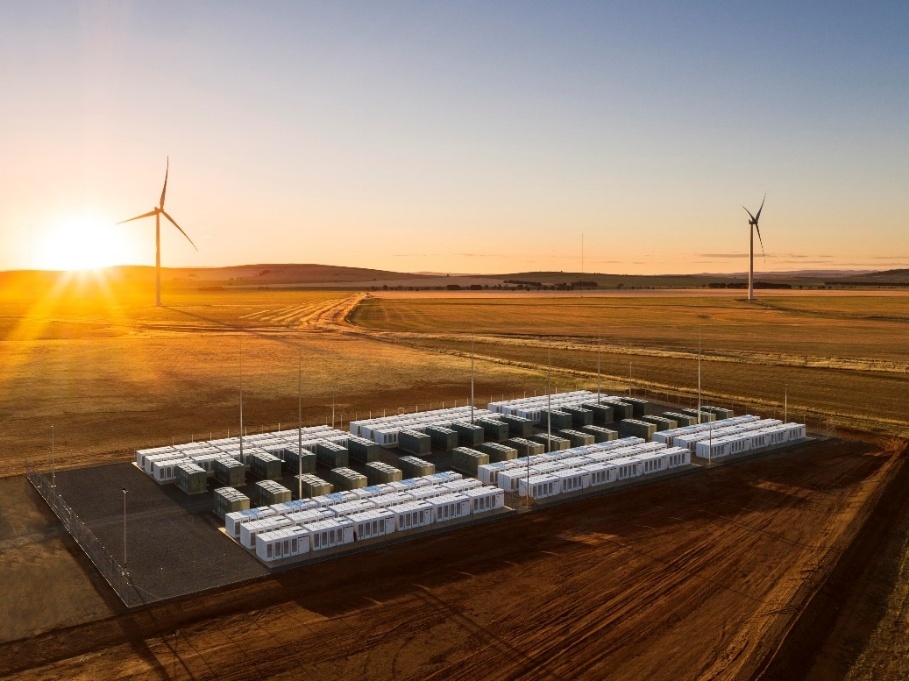
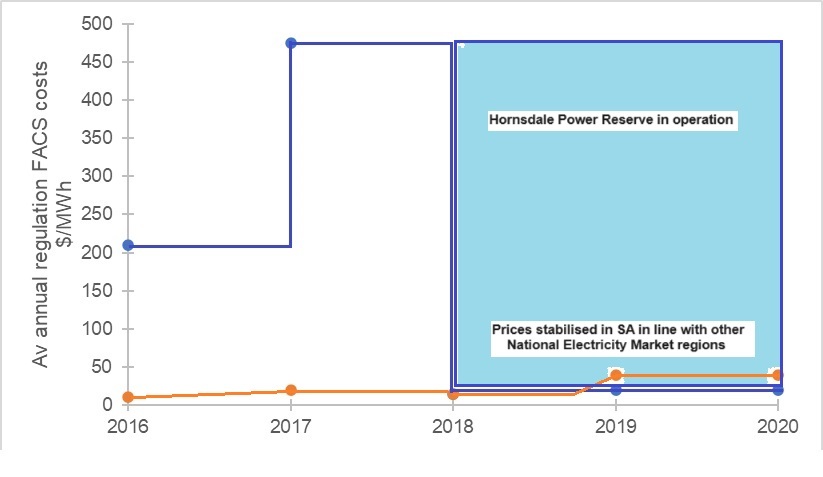
The first big battery was installed at the Hornsdale wind farm in 2017 and stored 100 MW/129 MWh. At the time it was the world’s largest battery. In 2020 it was expanded to 150 MW/ 193.5 MWh and provided inertia support which kept the electricity frequency within an acceptable range in the electricity grid. The National Electricity Market requires the power frequency to be kept at 50 HZ+/-0.15 HZ. In 2019 the battery reduced South Australia’s electricity costs by $116 M through its Frequency Control Ancillary Services. When the South Australian electricity system was “islanded” or separated from the rest of the grid, batteries stabilised the grid from frequency disruptions as they have near-zero start-up time. With wind and solar providing intermittent power, batteries help to manage this and stabilise the network.
_with_2_wind_turbines._reddit.jpeg)
GENERAL
Table 8 summarise proposed energy projects in October 2024 which are dominated by renewable projects.
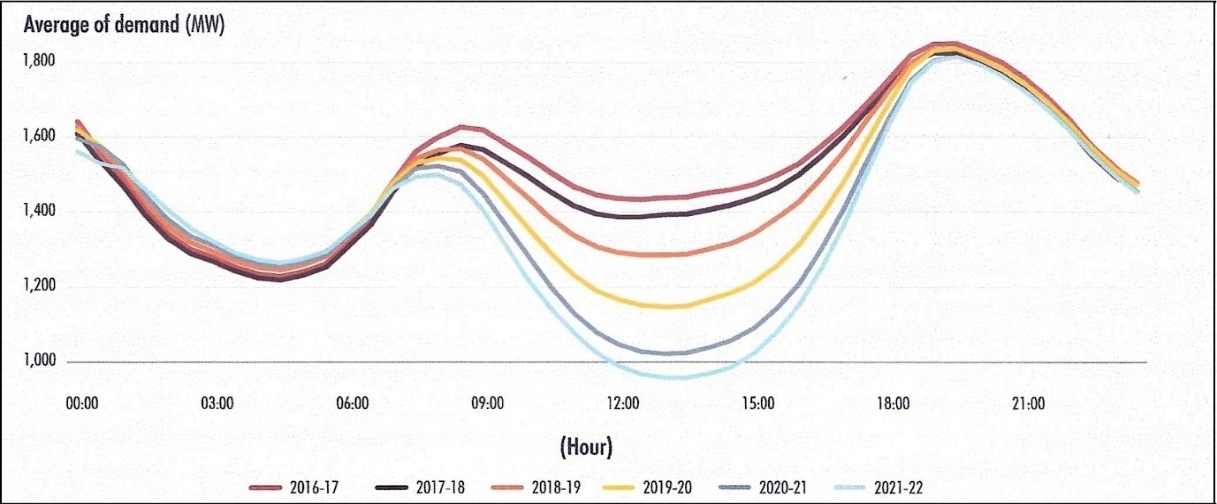
Use of South Australia’s electricity changes over the 24-hour day, being low during the night, peaking around breakfast time, sagging during the day and then rising to another peak in the early evening. This is known as the duck curve (Figure 10). Rooftop and utility solar peak during the day when demand is low while wind peaks during the night. The installation of household and utility batteries enables surplus electricity to be stored and released when demand is high.
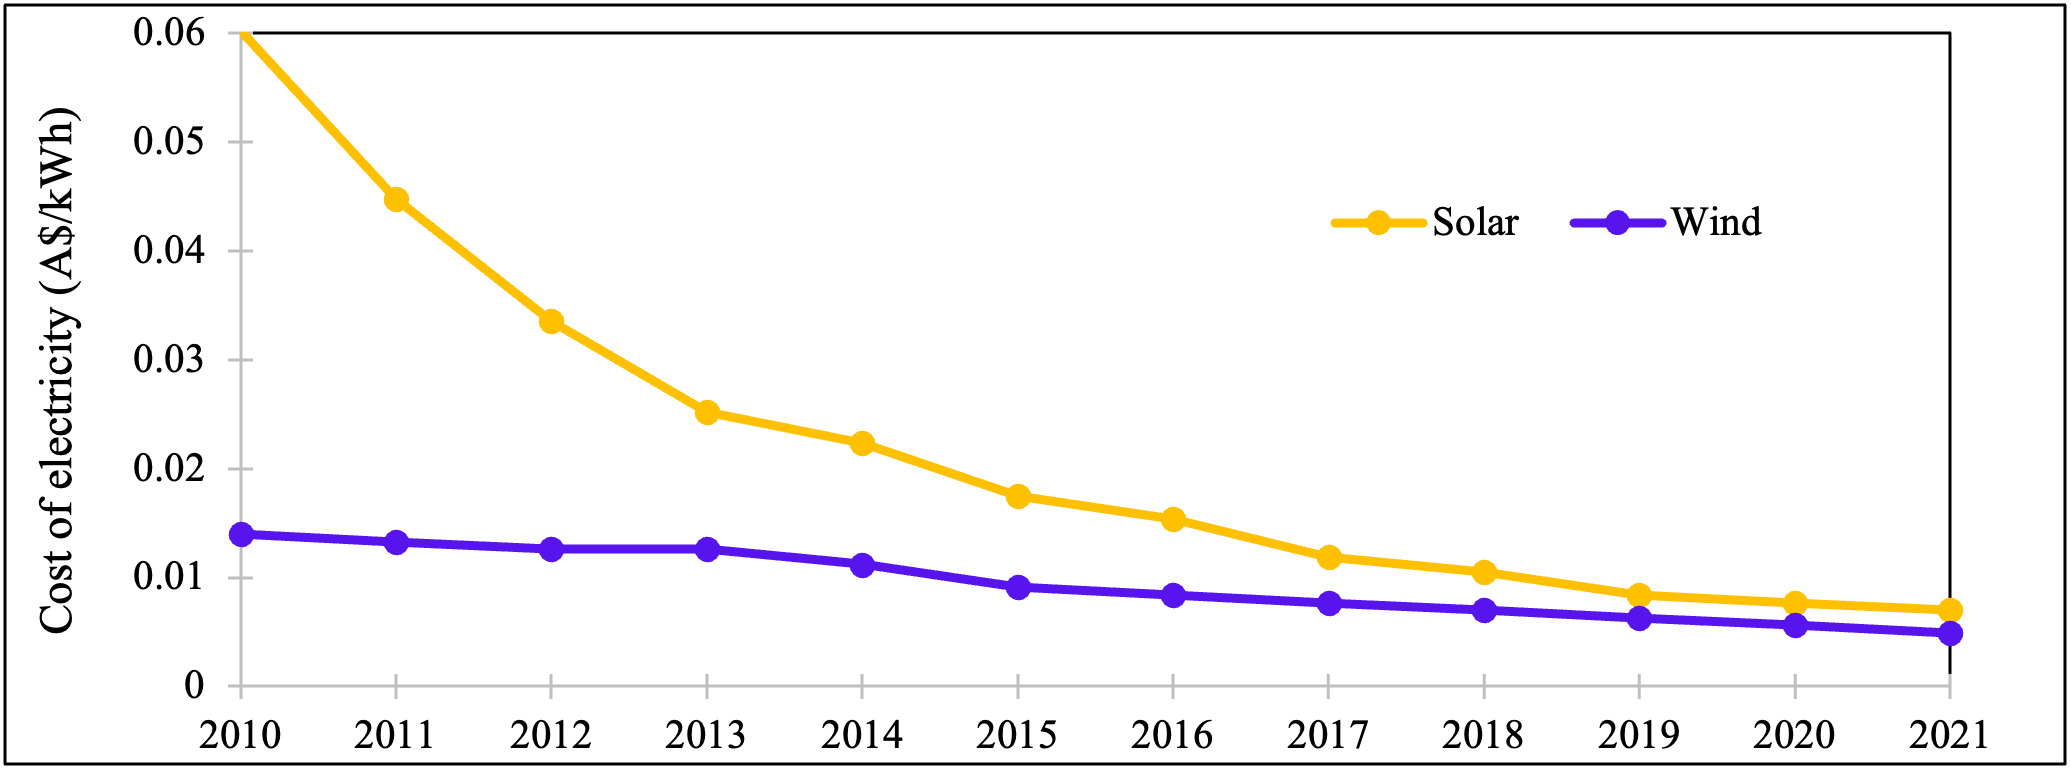
According to CSIRO’s GenCost report of 2024/25 (Graham et al., 2025), the capital cost of large scale solar was $1,463/kW, rooftop solar $1,336 and wind $3,351 compared with $2,455 for combined cycle gas, $9,321 for brown coal and $6,037 for black coal (Graham et al., 2025). Figure 11 indicates the fall in the cost of electricity from solar and over the past decade which has helped drive their uptake (AEMO, 2023).
.__aemo__y_572250_.png)
IMPACTS OF SOLAR PANELS
Water washing and dust suppression
Solar panels generally use rain to clean them of dust but where dust is prevalent such as in arid areas, cleansing with water may be necessary, taking care to not increase the fire hazard from grass. Dust on panels may reduce their energy production by up to 20% (Elminir et al., 2006). In deserts in the US, energy output declines by 0.3% per day for periods without rain (Kimber et al., 2006). There are many methods available for cleaning panels including robotic, heliotex, electrostatic, coating cleaning, vibrating cleaning, and forced-air cleaning (Olorunfemi et al., 2022).
Toxic chemicals
During their use, dust suppressants, rust inhibitors and antifreeze agents together with herbicides may be employed (Hernandez et al., 2014).
Land space
Unlike the widely distributed wind turbines in which grazing sheep and cattle can continue, solar panels occupy areas of land which could reduce their use for farming. In high quality agricultural areas such as the mid north or south east of South Australia, solar panels prevent planting with crops. Solar farms use around 2 ha per MW of solar capacity (CEC, 2021). Eighteen of the 46 solar farms listed lie outside Goyder’s Line, the northernmost extent of arable land which means they are not removing the better agricultural land.
A case study of a large solar farm in NSW found it used 0.02% of available agricultural land within the local government area which was considered negligible and equivalent to 1,500 tons of wheat per year (Guerin, 2019).
In 2021, the Clean Energy Council published guidelines on agrisolar, combining solar with agriculture. Low solar panels can be used for sheep grazing, horticulture and apiary while elevated panels can include fruit trees and viticulture. Grazing sheep reduces the fire hazard from tall grass, reducing the need for mowing or spraying. Moisture from condensation or rainfall on the solar panels drips below and aids pasture growth, even during drought while the panels themselves shade the ground, reducing evaporation and soil temperature. At Parkes, the wool quality of sheep grazed under the solar farm was high, even during droughts. Increased soil moisture also aids bees and extends their pollination services, improving crop yields. The shade provided by panels aids sheep health in otherwise exposed areas.
Biodiversity
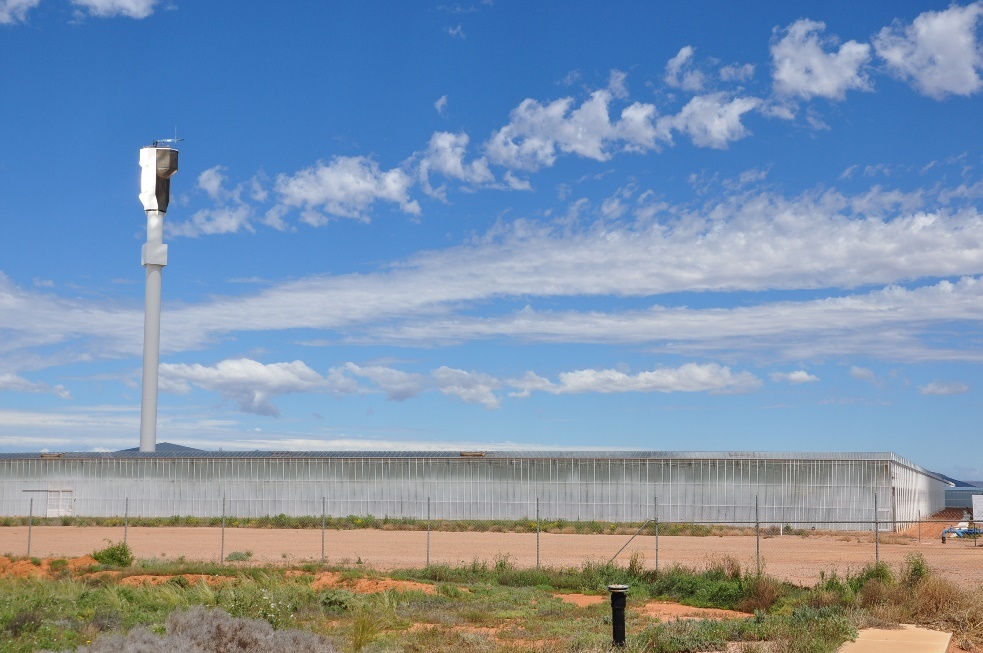
An issue of heliostats, such as the Sundrop Farms is the mortality of birds that fly in the path of the rays. This is a significant issue with a US estimate of 2.7 birds/MW/year (Walston et al., 2016). Data on bird mortality at the Sundrop site are not available but with a capacity of 39 MW, as many as 105 birds may be lost per year.
Solar panels and water polarise the light reflected from their surface, and birds and aquatic invertebrates can be attracted to the panels expecting them to be water (Taylor et al., 2019).
Albedo/heat flux
Rooftop solar provides shade to the roof, thereby reducing heat flux, providing energy savings and improving human comfort. Albedo, the proportion of sunlight that is diffusely reflected from a surface is measured from 0 for a black body that absorbed all radiation, to 1 that reflected all radiation. Being black, PV panels have an albedo of 0.18 – 0.23 absorbing much of the incoming solar radiation (Nemet, 2009). This compares with 0.17 for bare soil, 0.20 for grassland and cereals which indicates that solar panels do not appreciably alter the albedo.
Rooftop solar visual impact
The ubiquity of solar panels on Australian roofs has made them “part of the furniture”, something seen but not noticed. Anecdotally there have been few criticisms of their appearance, however some people find them ugly and disfiguring to the house. In an Australian-wide survey, Zander (2020) found that among those who did not want to install rooftop solar, “dislike of the panels’ appearance” was one of the main reasons with “disapproval by neighbours” being the principal reason.
Utility solar visual impact
Being large but essentially flat and of low elevation in the landscape, utility-size solar farms do not have the visual impact of the vertical wind turbines. Nevertheless, they do introduce an industrial-like feature into an agricultural landscape, and this can result in negativity. A participant in a survey in Slovenia reacting to a solar farm said “Awful… it could be idyllic if there weren’t solar cells in the back” (Bevk & Golobič, 2020). Solar farms do reduce the naturalness of the landscape and increase its perceived complexity (Torres-Sibille et al., 2009).
The South Australian landscape where utility solar farms are located is generally flat and often screened with trees and are therefore less noticeable than where the terrain is hilly.
Panels which move with sun tracking devices can result in glare. (Sullivan et al., 2012) found that non-glare effects can include changes in the colour, texture, scintillation, glinting and geometric patterns of star-like points of reflected light from the arrays which affect their contrast with their surrounds.
In a Slovenian survey, participants travelled through an area with six solar farms. They found that they were “highly noticeable and contentious objects. Participants who understood the landscape as a rural idyll disapproved of solar power plants, while for those who perceived the landscape through a utilitarian narrative, the (mis)fit of the solar power plant depended on its relation to the surrounding landscape structure” (Bevk & Golobič, 2020).
A proposal to construct the world’s largest solar farm in the Northern Territory to send electricity by cable across Indonesia to Singapore was assessed by a survey by (Zander et al., 2024). They found 70% of respondents were positive about the farm but a third felt it could “detract from the region’s environment as being inappropriate for the remote landscape, with Indigenous respondents being particularly cautious.” The survey found 32% regarded the array as an eyesore, while 36% thought it would have no aesthetic impact.
In 2015, surveyed prior to there being many utility scale solar farms, (Brook & Clark, 2015) found 87% of Australians in favour of rooftop solar and 78% in favour of utility solar (compared with 72% for wind farms). However, knowledge of utility solar was less than 20%.
A 2023 survey by CSIRO found 91% of South Australians indicated they would either tolerate, be OK with, approve, or embrace living near a solar farm (McCrea et al., 2024). Reducing the visual attractiveness of the local landscape was well down in the list of concerns about solar farms with the top concern being the waste created when they are decommissioned or reach their end of life. Removing land from farming was a negligible concern.
IMPACTS OF WIND FARMS
A CSIRO review in 2010 of nearly 50 newspaper articles on wind farms found the majority were opposed to them, the main reasons being landscape change and visual impacts, noise and inadequate consultation (Hall et al., 2012). Reducing greenhouse gas emissions and addressing climate change were positive factors. Interviews of locals near nine wind farms in NSW, Victoria and South Australia found strong community support for their development with their design, implementation and process of community engagement key to their success.
A review of 21 surveys of over 20,000 Australians between 2003 and 2018 found overwhelming support for wind farms (Lothian, 2020). The average overall support for wind farms was 75% while opposition averaged only 11%.
A CSIRO survey in 2023 found 86% of South Australians would either tolerate, be OK with, approve of, or embrace living near a windfarm (Poruschi et al., 2024). As for solar farms, reducing the visual attractiveness of the local landscape was well down in the list of concerns about wind farms with changes to the local natural environment being the top concern. The attitude towards transmission lines was slightly less positive, with 81% being prepared to tolerate, be OK with, approve of, or embrace living near lines.
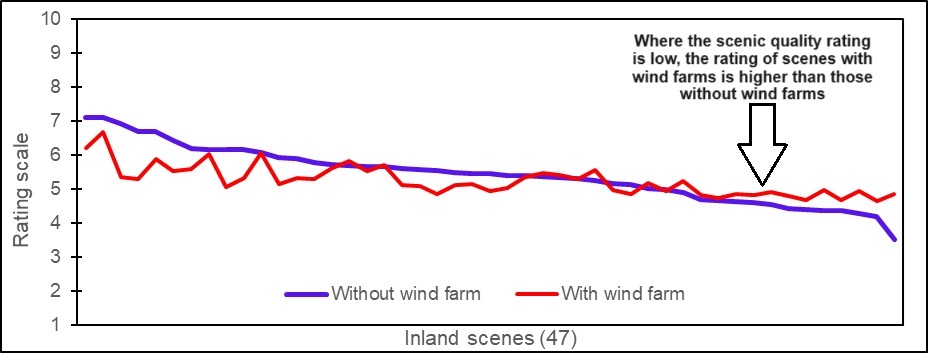
In 2003, when there were few wind farms in Australia, the author conducted a survey of South Australians using coastal and inland scenes into which images of wind farms were inserted. Participants rated the landscape quality on a 1-10 scale with and without the wind farm in the scenes which were shown in random order (Lothian, 2008). The results reflected a certain fear of wind farms as an unknown entity. For the coastal scenes, the presence of the wind farm lowered the mean rating from 7.61 to 6.09, a significant difference: p < 0.000. For inland scenes where water was not present, the ratings were lower. The presence of the wind farm lowered the mean rating from 5.47 to 5.21, a small but significant difference: p < 0.000. However, whereas in the coast, the wind farms resulted in lowering landscape quality for all scenes, for the inland scenes where the landscape quality was below 5.1, the presence of the wind farm actually enhanced the ratings of the landscape which was a surprising finding (Figure 11).

In 2018, when wind farms were a common feature in the landscape across southern Australia, the author conducted a second survey using scenes of 17 actual wind farms in NSW, Victoria and South Australia (Lothian, 2020). All but a handful of respondents had seen wind farms and 70% were in favour of them. The mean rating of the scenes without the wind farm was 6.48 and with the wind farm, 5.62, a significant difference: p < 0.000.

In the same survey, immediately after rating the landscape quality of the scene, participants were asked whether they considered the presence of the wind farm to be acceptable. Surprisingly, the majority found them acceptable or very acceptable. What was particularly surprising was that this applied to virtually all scenes including those of high scenic quality. Table 10 summarises the South Australian results and indicates that taking very acceptable and acceptable together, the result was 73% compared with only 16.5% who found them unacceptable or very unacceptable. Compared with the earlier survey, the results indicated that the community no longer feared wind farms and found them an acceptable intrusion into the rural landscape.
NEGATIVES ABOUT RENEWABLES
Renewables have enjoyed strong public support and participation, but there are several issues of concern.
The Australian Energy Infrastructure Commissioner reviewed complaints about renewables and over the eight-year period, 2015 – 2023, dealt with 975 cases, 59% of which were wind farms, 22% for transmission projects and only 2% were for solar farms (AEIC, 2024). Only 43 cases were from South Australia. Loss of amenity, which includes landscape impacts, was the top concern.
The past several years has seen a contraction in the number of new wind farms coming online. This has put into jeopardy achieving the Federal Government’s target of the electricity sector generating at least 82% by 2030 and will probably achieve only 70% (Reeve, 2024). The major factor involved is the need for more transmission lines to take the electricity from where it is generated to where it is required. The Australian Energy Market Operator estimated that 10,000 km of new transmission lines needed to be constructed urgently to meet energy targets (Westerman, 2023). Some rural communities have objected to transmission proposals.
At the end of 2023, the Federal Government expanded the Capacity Investment Scheme (CIS) which funds investment in renewables with a further $20 B to fund new transmission lines. The CIS aimed to deliver a further 32 GW of capacity by 2030 and deliver on the Government’s 82% target but cost overruns, regulatory delays and opposition on the ground slowed progress. While most of the transmission issues lie in NSW and Victoria, the interstate transmission link, EnergyConnect, between NSW and South Australia has also been affected (Wood, 2024).
A consequence of the transmission bottleneck is the spilling of electricity that has been generated, failing to reach its destination due to congestion in the network or because the generator reduces output due to low market prices. During 2023, spilled electricity across Australia amounted to around three months of electricity consumption in South Australia or 8.5% of the total potential (McConnell, 2024). A figure of 5% is considered reasonable for renewables. However, as Chris Bowen, the Minister for Climate Change and Energy said, “if we have further transmission delays, batteries become more and more useful for every year of delay, …we can use batteries in the near term to decongest the existing network.” (MacDonald-Smith, 2023).
A third issue lies in the need for land for renewables, as (McBain, 2021) put it: “Renewables need land – and lots of it”. While renewables need to be built where they will perform best, building them in rural areas is a “complex social undertaking.” An advantage for farmers is that renewables can provide a significant second income of tens of thousands of dollars per year. However, while the farm on which the renewables are located gains from them, their neighbours do not. The Australian Energy Infrastructure Commissioner has proposed payments to neighbours through Neighbour Agreements, and some developers have adopted this.
CONCLUSIONS
Few examples of public policy in Australia have gained such widespread support and investment as renewable energy, driven by the community’s desire to address climate change as well as gaining from the financial incentives offered. It is unlikely that the originators of the policies and programs that stimulated renewables envisaged the positive results that eventuated.
Climate change is often portrayed as a ‘wicked problem’, one which is multi-faceted and highly resistant to solutions. In 2007, the year that renewables ‘took off’, the Australian Public Service Commission (APSC, 2007) issued a bulletin, Tackling wicked problems: A public policy perspective, which cited climate change along with obesity, indigenous disadvantage and land degradation as examples. Perhaps the mandarins took its messages to heart of seeking whole-of-government solutions, working with State Governments and the private sector, and engaging stakeholders in “creating shared understanding about the problem, and shared commitment to the possible solutions.”
While some issues remain with the roll-out of renewables, these are not insuperable or of great significance. The presence of rooftop solar along with utility solar and wind farms have transformed the appearance of Australian cities and rural landscapes but not in a way that most people find insufferable.